Quantcast
Channel: MoneyScience: MoneyScience's news channel - Musings on Markets
Viewing all 146 articles
Browse latest View live

January 2016 Data Update 5: Making a case for corporate governance

$
0
0

In my last post, I looked at the cost of capital, a measure of what it costs firms to raise capital. That capital, if put to good use by businesses, should earn returns higher than the costs to generate value. Simply put, the end game in business is not just to make money but to make enough to cover a risk-adjusted required return. In publicly traded companies, it is managers at these companies, for the most part, who are investing the capital that comes from stockholders and bondholders (or banks), and corporate governance is a measure of whether these managers are being held accountable for their investment decisions.

Defining a good investment
It is true that there are differences of opinion about how best to measure the cost of raising funds, but disagreements about the cost of capital are drowned out by disputes on how best to measure the returns that are generated by investing this capital. There are two widely used proxies for profitability. One is the profit margin, obtained by dividing the earnings by the revenues of the firm, and it can be estimated using either operating income (operating margin) or net income (net margin). Since the latter is a function of both the profitability of businesses and how much they have chosen to borrow, I will focus on operating margins and report on the distribution of both pre-tax and after-tax operating margin in the graph below:
Source: Damodaran Online
The second measure of profitability, and perhaps the more useful one in the context of measuring the quality of an investment, is obtained by scaling the operating earnings to the capital invested in a project or assets to estimate a return on invested capital. The capital invested is usually computed by aggregating the book values of debt and equity in a business and netting out the cash. The resulting return on invested capital can be compared to the cost of capital to arrive at the excess return (positive or negative) earned by a firm. In the figure below, I look at the mechanics of the return on capital computation in the picture below.

Note the caveats that I have added  to the picture, listing the perils of trusting two accounting numbers: operating income and invested capital. I did try to correct for the accounting misclassifications, converting leases into debt and R&D into capital assets, and also computed an alternate return on capital measure, based on average earnings over the last ten years. Notwithstanding these adjustments, I am still exposed to a multitude of accounting problems and I have to hope and pray that the law of large numbers will bail me out on those.

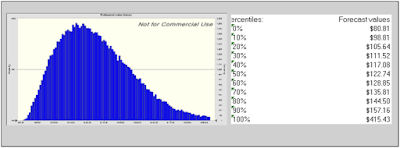
I computed the return on invested capital for each of the 41,889 firms in my sample and subtracted out the cost of capital for each one to arrive at an excess return. The graph below captures the distribution of this excess return across global firms in 2015:

Overall, more than half of all publicly traded firms, listed globally, earned returns on capital that were lower than the cost of capital in 2015 and this conclusion is not sensitive to using average income or my adjustments for R&D and leases. The return on capital is a flawed measure and I have written about the adjustments that are often needed to it. That said, with the corrections for leases and R&D, it remains the measure that works best across businesses in capturing the quality of investments.

Industry Excess Returns
In the second part of the analysis, I broke down the 41,889 companies into 95 industry grouping and computed the excess returns for each industry group.  The full results are at this link, but I ranked companies based on the magnitude of the excess returns. Again, with all the reservations that you can bring into this measure of investment quality, the businesses that delivered the highest spreads (over and above the cost of capital) are listed below.


The best-performing sector is tobacco, where companies collectively earned a return on capital almost 22% higher than the cost of capital. One potential problem is that many of the businesses on this list also happen to be asset-light, at least in the accounting sense of the word, and some of these returns may just reflect our failure to fully capitalize assets in these businesses.

Looking at the other end of the spectrum, the following is a list of the worst performing businesses in 2015, based on returns generated relative to the cost of capital.

Note that oil companies are heavily represented on this list, not surprising given the drop in oil prices during the year. That, of course, does not make them bad businesses since a turning of the commodity price cycle will make the returns pop. There are other businesses that have been affected by either the slowing down of the China growth engine, such as steel and shipbuilding, and the question is whether they can bounce back if Chinese growth stays low. Finally, there are some perennially bad businesses, with auto and truck being one that has managed to stay on this list every year for the last decade, grist for my post on bad businesses and why companies stay in them.

In computing this excess return, I deliberately removed financial service firms from the mix, because computing operating income or invested capital is a difficult, if not impossible task, at these firms. Lest you feel that I am giving managers at these firms a pass on the excess return question, I would replace the excess return spread (ROIC - Cost of capital) with an equity excess return spread (ROE - Cost of Equity) for these companies.

Regional Differences
Are firms in some parts of the world  better at putting capital to work than others? To answer that question, I broke my global sample into sub-regions and computed both operating margins and excess returns (return on invested capital, netted out against cost of capital) in each one.


Looking at the list, the part of the world where companies seem to have the most trouble delivering their cost of capital is Asia, with Chinese companies being the worst culprits and India being the honorable exception. US and UK companies do better at delivering returns that beat their hurdle rates than European companies.

Again, I would be cautious about reading too much into the differences across regions, since they may be just as indicative of accounting differences, as they are of return quality. It is also possible that some of the regions might have a tilt towards industries that under performed during the year and their returns will reflect that. Thus, the excess returns in Australia and Canada, which have a disproportionate share of natural resource companies, may be reflecting the drubbing that these companies took in 2015. 

A Case for Corporate Governance
I have been doing this analysis of excess returns globally, each year for the last few, and my bottom line conclusions have stayed unchanged.
  1. The value of growth: If the value of growth comes from making investments that earn more than your hurdle rate, growth in a typical publicly traded company is more likely to destroy value than to increase value (since more than 50% of companies earn less than their cost of capital). For investors and management teams in companies, I would view this as a signal to not rush headlong into the pursuit of growth.
  2. Bad management stays bad: In my sample, there are firms that have been earning excess returns year after year for most of the last decade, casting as a lie any argument that managers at these firms might make about "passing phases" and "bad years" affecting the numbers. To the question of why these managers continue to stay on, the answer is that in many parts of the world, it is almost impossible to dislodge these managers or even change how they behave.
  3. Bad businesses: There are entire businesses that have crossed the threshold from neutral to bad businesses, but management seems to be in denial. These are the businesses that I have described in my corporate life cycle posts as the "walking dead" companies and I have explored why they soldier on, often investing more into these investing black holes.
Is good corporate governance the answer to these problems? In much of the world, the notion that stockholders are part owners of a company is laughable, as corporations continue to be run as if they were private businesses or family fiefdoms, and politics and connections, not stockholder interests,  drive business decisions in others.. Even in countries like the United States, where there is talk of good corporate governance, it has become, for the most part, check-list corporate governance, where the strength of governance is measured by how many independent directors you have and not by how aggressively they confront managers who misallocate capital. Institutional investors have been craven in their response to managers, not just abdicating their responsibility to confront managers, where needed, but actively working on behalf of incumbent managers to fight off change. The sorry record of value creation at publicly traded companies around the globe should act as a clarion call for good corporate governance. In the words of Howard Beale, from Network, we (as stockholders) should be "mad as hell and should not take it any more".

  1. Paper on measuring ROIC, ROC and ROE (Warning: Extremely boring but could be cure for amnesia. Don't read for excitement value!)
Data Update Posts
  1. January 2016 Data Update 1: The US Equity Market 
  2. January 2016 Data Update 2: Interest Rates and Exchange Rates - Currencies 
  3. January 2016 Data Update 3: Country Risk and Pricing
  4. January 2016 Data Update 4: Costs of Equity and Capital
  5. January 2016 Data Update 5: Investment Returns and Profitability
  6. January 2016 Data Update 6: Capital Structure
  7. January 2016 Data Update 7: Dividend Policy
  8. January 2016 Data Update 8: Pricing and Valuation


January 2016 Data Update 6: Debt, the double edged sword!

$
0
0

In corporate finance, the decision on whether to borrow money, and if so, how much has divided both practitioners and theorists for as long as the question has been debated. Corporate finance, as a discipline, had its beginnings in Merton Miller and Franco Modigliani's classic paper on the irrelevance of capital structure. Since then, theorists have finessed the model, added real life concerns and come to the unsurprising conclusion that there is no one optimal solution that holds across companies. At the same time, practitioners have also diverged, with the more conservative ones (managers and investors) arguing that debt brings more pain than gain and that you should therefore borrow as little as possible, and the most aggressive players positing that you cannot borrow too much.

The Trade off on debt
The benefits of debt, for better or worse, are embedded in the tax code, which in much of the world favors borrowers. Specifically, a company that borrows money is allowed to deduct interest expenses before paying taxes, whereas one that is equity funded has to pay dividends out of after-tax earnings. This, of course, makes it hypocritical of politicians to lecture any one on too much debt, but then again, hypocrisy is par for the course in politics. A secondary benefit of debt is that it can make managers in mature, cash-rich companies a little more disciplined in their project choices, since taking bad projects, when you have debt, creates more pain (for the managers) than taking that same projects, when you are an all equity funded company.

On the other side of the ledger, debt does come with costs. The first and most obvious one is that it increases the chance of default, as failure to make debt payments can lead to financial distress and bankruptcy. The other is that borrowing money does create the potential for conflict between stockholders (who seek upside) and lenders (who want to avoid downside), which leads to the latter trying to protect themselves by writing in covenants and/or charging higher interest rates.

Pluses of DebtMinuses of Debt
1. Tax Benefit: Interest expenses on debt are tax deductible but cash flows to equity are generally not. The implication is that the higher the marginal tax rate, the greater the benefits of debt.1. Expected Bankruptcy Cost: The expected cost of going bankrupt is a product of the probability of going bankrupt and the cost of going bankrupt. The latter includes both direct and indirect costs. The probability of going bankrupt will be higher in businesses with more volatile earnings and the cost of bankruptcy will also vary across businesses.
2. Added Discipline: Borrowing money may force managers to think about the consequences of the investment decisions a little more carefully and reduce bad investments. The greater the separation between managers and stockholders, the greater the benefits of using debt.2. Agency Costs: Actions that benefit equity investors may hurt lenders. The greater the potential for this conflict of interest, the greater the cost borne by the borrower (as higher interest rates or more covenants). Businesses where lenders can monitor/control how their money is being used can borrow more than businesses where this is difficult to do.

In the Miller-Modigliani world, which is one without taxes, bankruptcies or agency problems (managers do what's best for stockholders and equity investors are honest with lenders), debt has no costs and benefits, and is thus irrelevant. In the world that I live in, and I think you do too, where taxes not only exist but often drive big decisions, default is a clear and ever-present danger and conflicts of interests (between managers and stockholders, stockholders and lenders) abound, some companies borrow too much and some borrow too little.

The Cross Sectional Differences
Looking at the trade off, it is clear that 2015 tilted more towards the minus side than plus side of the equation for debt, as the Chinese slowdown and the commodity price meltdown created both geographic and sector hot spots of default risk. As in prior years, I started by looking at the distribution of debt ratios across global companies, in both book and market terms:
Debt to capital (book) = Total Debt/ (Total Debt + Book Equity)
Debt to capital (market) = Total Debt/ (Total Debt + Market Equity)
In keeping with my argument that all lease commitments should be considered debt, notwithstanding accounting foot dragging on the topic, I include the present value of lease commitments as debt, though I am hamstrung by the absence of information in some markets. I also compute net debt ratios, where I net cash out against debt, for all companies:
Damodaran Online
While debt ratios provide one measure of the debt burden at companies, there are two other measures that are more closely tied to companies getting into financial trouble. The first is the multiple of debt to EBITDA, with higher values indicative of a high debt burden and the other is the multiple of operating income to interest expenses (interest coverage ratio), with lower values indicating high debt loads. In 2015, the distribution of global companies on each of these measures is shown below:

By itself, there is little that you can read into this graph, other than the fact that there are some companies that are in danger, with earnings and cash flows stretched to make debt payments, but that is a conclusion you would make in any year.

The Industry Divide
To dig a little deeper into where the biggest clusters of companies over burdened with debt are, I broke companies down by industry and computed debt ratios (debt to capital and debt to EBITDA) by sector. You can download the entire industry data set by clicking here, but here are the 15 sectors with the most debt (not counting financial service firms), in January 2016.
Damodaran Online, January 2016
There is a preponderance of real estate businesses on this list, reflecting the history of highly levered games played in that sector. There are quite a few heavy investment businesses, including steel, autos, construction shipbuilding, on this list. Surprisingly, there are only two commodity groups (oil and coal) on this section, oil/gas distribution, but it is likely that as 2016 rolls on, there will be more commodity sectors show up, as earnings lag commodity price drops.

In contrast, the following are the most lightly levered sectors as of January 2016.
Damodaran Online, January 2016
The debt trade off that I described in the first section provides some insight into why companies in these sectors borrow less. Notice that the technology-related sectors dominate this list, reflecting the higher uncertainty they face about future earnings. There are a few surprises, including shoes, household products and perhaps even pharmaceutical companies, but at least with drug companies, I would not be surprised to see debt ratios push up in the future, as they face a changed landscape.

The Regional Divides
If the China slow-down and the commodity pricing collapse were the big negative news stories of 2015, it stands to reason that the regions most exposed to these risks should also have the most companies in debt trouble. The regional averages as of January 2016 are listed below:
Damodaran Online, Data Update of 41,889 companies in January 2016
The measure that is most closely tied to the debt burden is the Debt to EBITDA number and that is what I will focus on in my comparisons. Not surprisingly, Australia, a country with a disproportionately large number of natural resource companies, tops the list and it is followed closely by the EU and the UK.  Canada has the highest percentage of money-losing companies in the world, again due to its natural resource exposure. The companies listed in Eastern Europe and Russia have the least debt, though that may be due as much to the inability to access debt markets than an unwilling to borrow as it is to uncertainty about the future. With Chinese companies, there is a stark divide between mainland Chinese companies that borrow almost 2.5 times more than their Hong Kong counterparts. If you are interested in debt ratios in individual countries, you can see my global heat map below or download the datasets with the numbers.


If the biggest reason for companies sliding into trouble in 2015 were China and Commodities, the first three weeks of 2016 have clearly made the dangers ever more present. As oil prices continue to drop, with no bottom in sight, and the bad news on the Chinese economy continue to come out in dribs and drabs, the regions and sectors most exposed to these risks will continue to see defaults and bankruptcies. These, in turn, will create ripples that initially affect the banks that have lent money to these companies but will also continue to push up default spreads (and costs of debt) for all firms. 

The Bottom Line
Debt is a double edged sword, where as you, as the borrower, wield one edge against the tax code and slice your taxes, the other edge, just as sharp, is turned against you and can hurt you, in the event of a downturn. In good times, companies that borrow reap the benefits of debt, slashing taxes paid and getting rewarded with high values by investors, who are just as caught up in the mood of the moment. In bad times, which inevitably follow, that debt turns against companies, pushing them into financial distress and perhaps putting an end to their existence as ongoing businesses.  One constraint that I will bring into my own investments decisions in 2016 is a greater awareness of financial leverage, where in addition to valuing businesses as going concerns, I will also look at how much debt they owe. I will not reflexively avoid companies that have borrowed substantial amounts, but I will have realistically assess how much this debt exposes them to failure risk, before I pull the "buy" trigger.

Datasets
  1. Debt Ratios, by sector (January 2016)
  2. Debt Ratios, by country (January 2016)

January 2016 Data Update 7: Dividends, Potential Dividends and Cash Balances

$
0
0

In the last six posts, I have tried to look at the global corporate landscape, starting with how the market is pricing risk in the US and globally, how much investors are getting as risk free returns in different currencies and then moving on to differences across companies on the costs of raising funding (it varies by sector and region),  the quality of their investments (not that good) and their indebtedness (high in pockets). In this, the last of these posts, I propose to look at the final piece of the corporate finance picture, which is how much companies around the world returned to stockholders in dividends (and stock buybacks) and by extension, how much cash they chose to hold on for future investments. 

Dividends, Potential Dividends and Cash
Dividend policy is often the ignored step child of corporate finance, treated either as an obligation that has to be met by companies or as a sign of weaknesses by those who believe that companies exist only to build factories and invest resources. The reality is that dividends are a central reason for investing and unless cash gets returned to investors, and I am willing to expand my notion of dividends to include buybacks, there is no real payoff to investing. That said, the question of how much a company can pay in dividends is affected in most businesses, by investing and financing choices. If equity is a residual claim, as it is often posited to be, dividends should be the end-result of a series of decisions that companies make:

If  you accept the logic of this process, companies that have substantial cash from operations, access to debt and few investment opportunities should return more cash than companies without these characteristics.

In practice, the sequencing is neither this clean, nor logical. Dividend policy, more than any other aspect of corporate finance, is governed by inertia (an unwillingness to let go of past policy) and me-too-ism (a desire to be like everyone else in the sector) and as a consequence, it lends itself to dysfunctional behavior. In the first dysfunctional variant, rather than be the final choice in the business sequence, dividends become the first and the dominant part driving a business, with the decision on how much to pay in dividends or buy back in stock made first, and investment and financing decisions tailored to deliver those dividends. 

Not surprisingly, dividends then act as a drain on firm value, since companies will borrow too much and/or invest too little to maintain them.  In a diametrically opposite variant, managers act as if they own the companies they run, are reluctant to let go of cash and return as little as they can to stockholders, while building corporate empires.


These companies can afford to pay large dividends, choose not to do so and end up, not surprisingly, with huge cash balances. It is worth noting that the corporate life cycle, a structure that I have used repeatedly in my posts, provides some perspective on how dividend policy should vary across companies.

Dividend Policies across Companies
As with my other posts on the data, I started by looking at the dividends paid by the 41,889 companies in my sample, with an intent of getting a measure of what constitutes high or low dividends. So, here were go..

1. Measures of dividends: There are two widely used measures of dividends. The first when dividends are divided by net income to arrive at a dividend payout ratio, a measure of what proportion of earnings gets returned to stockholders (and by inversion, what proportion gets retained in the firm). The distribution of dividend payout ratios, using dividends and earnings from the most recent 12 months leading into January 2016,  is captured below:
Source: Damodaran Online
Note that more firms (23,022) did not pay dividends, than did (18,867), in 2015. Among those companies that paid dividends, the median payout ratio is between 30% and 40%.

The other dividend statistic is to divide dividends paid by market capitalization (or dividends per share by price per share) to estimate a dividend yield, a measure of the return that you as a stockholder can expect to generate from the dividends, on your investment. The rest of your expected return has to come from price appreciation. Again, using trailing 12-month dividends leading into and the price as of December 31, 2015, here is the distribution:
As with the payout, the yield is more likely to be zero than a positive number for a globally listed company, but the median dividend yield for a stock was between 2% and 3% in 2015.

2. The Buyback Option: For much of the last century, dividends were the only cash flows that stockholders in corporations received from the corporations. Starting in the 1980s, US companies have increasingly turned to a second option to returning cash to stockholders, buybacks. From an intrinsic value perspective, buybacks have exactly the same consequences to the company making them, as dividends, reducing cash in the hands of the company and increasing cash in the hands of stockholders. From the stockholders' perspective, there are differences, since every stockholder gets dividends (and has to pay taxes on it) while only those who sell their shares back get cash with buybacks, but leave the remaining stockholders with higher-priced stock. In the table below, I look at the proportion of the cash returned that took the form of buybacks for companies in different regions in the twelve months leading into January 2016:
While it is true that US companies have been in the forefront of the buyback boom, note that the EU and Japan are not far behind. Buybacks are not only here to stay, but are becoming a global phenomenon.

3. The Cash Balance Effect: Any discussion of dividends is also, by extension, a discussion of cash balances, since the latter are the residue of dividend policy. In this final graph, I look at cash balances at companies, as a percent of the market capitalizations of these companies. 
You may be a little puzzled about the companies that have cash balances that exceed the market capitalizations, but it can be explained by the presence of debt. Thus, if your market capitalization is $100 million and you have $150 million in debt outstanding, you could hold $150 million of that value in cash, leaving you with cash at 150% of market capitalization.

Industry Differences: The Me Too Effect
If a key driver of dividend policy is a desire to look like your peer group, it is useful to at least get a measure of how dividend policy varies across industries. Using my 95 industry groups as the classification basis, I looked at dividend yields and payout ratios, as well as the proportion of cash returned in buybacks and cash balances, and you can download the data here. While there are many measures on which you can rank industries on dividend policy, I decided to do the rankings based on the cash balances, as a percent of market capitalization, because it is the end result of a lifetime of dividend policy. In the table below, I list the 15 industries that have the lowest cash balances, as a percent of market capitalization, in January 2016.
While this is a diverse listing, most of these industries are in mature businesses, where there is little point to holding cash and one reason for the low cash balances is that many of the companies in these sectors return more cash than they have net income.

At the other end of the spectrum are industries, where cash accumulation is the name of the game. Below, I list the 15 industries (not including financial services, where cash has a different meaning and a reason for being) that had the highest cash balances as a percent of market capitalization.

In a few of these businesses, such as engineering and real estate development, the cash balances may reflect operating models, where the cash will be used to develop properties or on large projects and is thus transitional. There are other businesses, such as auto, shipbuilding and mining, where managers may be using cyclicality (economic or commodity) as a rationale for the cash accumulation. The ratio may also be skewed upwards in highly levered companies, since market capitalization is a smaller percent of overall value in these companies.

Regional Differences
If me-tooism is the driver of why companies in a sector often have similar dividend policies, can it also extend to regions? To examine that question, I started by looking at dividend statistics, by region:
Companies in Australia, Canada and the UK returned more cash collectively, in dividends, than they generated in net income, a reflection of both tax laws that favor dividends and a bad year for commodities (at least for the first two). Japanese companies are cash hoarders, paying the least in dividends and holding on to the most cash. Indian companies are cash poor on every dimension, paying little in dividends and having the least cash, as a percent of market capitalization, of any of the regional groupings. Finally, while much has been made about how much cash has been accumulated at US companies (about $2 trillion), the cash balance, as a percent of market capitalization, is among the  lowest in the world. Absolute values are deceptive, since they will skew you towards the largest markets.

I also computed dividend statistics (dividend yield, cash dividend payout, cash return payout and cash as a percent of market capitalization) by country and plotted them on a heat map:
Note that in some of these countries, the sample sizes are small and the statistics have to be taken with a lot of salt.

The Bottom Line
For both managers and investors, dividends are more than just a return of cash for which companies have no use. Dividends become a divining rod for the company's health, a number that companies stick with through good times and bad and one that has its roots in imitation more than fundamentals. Consequently, companies often get trapped in dividend policies that don't suit them, either paying too much and covering up the deficit with debt and investment cut backs or paying too little and accumulating mountains of cash.

Corporate Finance 101: A Big Picture, Applied Class!

$
0
0

In my last seven posts, I played my version of Moneyball with company data from the end of 2015, looking at how companies invest their shareholders' money, how much they borrow and the determinants of how much cash they return to stockholders. That structure is the one that underlies the corporate finance class that I have taught every year since 1984, the first two years at UC Berkeley, and the last 30 years at the Stern School of Business. Each semester, for the last few years, I have also invited you, even if you are not a Stern MBA student, to follow the class online, if you so desire, in all its gory details. If you are considering this options, I thought it would make sense to take you on a mini-tour of corporate finance, as a discipline, and how I aim to tackle it in this class.

Corporate Finance: The Big Picture
There are many versions of corporate finance that are taught in class rooms. There is the accounting version of corporate finance, that uses the historical, rule-bound construct of accounting as the basis for corporate finance. Decision making is driven by accounting ratios and financial statements, rather than first principles. There is the banking version of corporate finance, where the class is structured around what bankers do for firms, with the bulk of the class being spent on areas where firms interact with financial markets (M&A, financing choices) and the focus is less on what's right for the firms, and more on how the deal making works. My version of corporate finance is built around the first principles of running a business and it covers every aspect of business from production to marketing to even strategy. In case you are skeptical about the big picture version of this class, here is what it looks like:
All of corporate finance boils down to three broad decisions, the investment decision, which looks at where you should invest your resources, the financing decision, where you decide the right mix and type of debt to use in funding your business and the dividend decision, where you determine how much to hold back in the business (as cash or for reinvestment) and how much to return to the owners of the business.

Applied, not Theory
I find theory for the sake of theory to be arid, and I build my classes around a very simple proposition: if it cannot be applied, I don't talk about it. That application focus may put you off, but my class is essentially the equivalent of a corporate finance lab, where when I introduce a model or a hypothesis,  I get to try it out on real companies in real time. I use six companies through the entire class to illustrate both the theory and how its application can vary across companies:


Thus everything I do in the class, from estimating hurdle rates to determining finance mix to assessing dividend policy, I try on Disney (a large, US, entertainment firm), Vale (a global mining company, based in Brazil, with a government interest in it), Tata Motors (an India-based auto company, part of a family group), Baidu (a Chinese search engine company, traded as a shell company on the NASDAQ), Deutsche Bank (a messy, money center bank, with regulatory constraints) and a small privately owned bookstore in New York City (owned by a third-generation owner).

The Class Structure
The class starts on February 1, with a session from 10.30 to 11.50, and continues through May 9, with sessions every Monday and Wednesday, with a break week starting March 14. The lectures are supplemented with slides and my book on applied corporate finance, with the latter being completely optional, since you can live without it.  The calendar for the class is at this link.

There will be three 30-minute quizzes in the class, each worth 10%, spread out almost evenly across the first 22 sessions, and each quiz will be non-cumulative, covering only the 6-7 sessions prior. In keeping with my view that this is not about memorizing equations and formulas, the quizzes will be open books and open notes. There is a two-hour final exam, which is cumulative and will be after the final session  in May that will account for 30% of the grade.

There will be two projects, with the first being an investment case (that I have not written yet) that will make you decide on whether to make a big investment or not (Apple in the electric car market, Google buying Twitter etc.) and the second being a semester-long exercise of trying every aspect of corporate finance on a company of your choice.

The Online Version
If you are in my class, there is little more to be said, since I will see you in class on Monday. If you are not, you can still partake in almost all of the class. The lectures will not be carried live, but will be recorded and the webcasts should be up by late in the day, Mondays and Wednesdays, through the entire semester. You can find those webcasts in one of three forums:
  1. My website: The links to the webcasts, as well as links to my other material (lecture notes, handouts, even emails to the class) can be found at this link
  2. iTunes U: If you prefer a more polished format, I will also be putting the class online on iTunes U, the app that you can download from the Apple store for any Apple device. The link to the class is here and if already have Apple iTunes U installed on your device, you can add this class with the enroll code of EPF-JFH-SHE. 
  3. YouTube Playlist: I will also be putting the classes up on a playlist on my YouTube account. With each session that I put up, I will also add links to the lecture notes used in the session and additional exercise. 
Not only can you watch the lectures and review the notes, you can also try your hand at the quizzes and final exam, when they are given. I will post the exams, after the class has taken them, online and  I will post the solution, with the grading template that I used in class. You will be your own grader and may be tempted to go easy on yourself, but that's your choice. You can even do the case and the project, but I will unfortunately not have the resources to review or grade either. The good news is that none of this should dent your pocket book, but the bad news is that you will not get class credit or a certificate.

Alternative Routes
Each semester, I know that quite a few people start with my classes, but life very quickly gets in the way. One of the problems of online classes is that without the discipline of having to get to a physical class or concern about credit/grades, it is difficult to persevere to the end. I entirely understand this problem and if, after trying one or two classes or even a few, you decide that your life is too full for more stuff to be added on. I do have a few suggestions, if you still feel that you will gain from the class:
  1. Stretch it out: The class will stay online on all three forums for at least a year or two. Thus, you can stretch out the class to match your time schedule, instead of taking it in calendar time. I had at least three or four people completing the Spring 2012 class, last year.
  2. Online Corporate Finance class: If you find the 80-minute class sessions that make up this class unendurable, I do have a compressed version of the class, where I take each session and do it in 10-15 minutes, instead of 80 minutes. In a testimonial to how much we bulk up college classes, it was not that tough to do and you can find it on my website at this link, on iTunes U at this one or on YouTube at this one.
  3. Executive Corporate Finance class: I just completed a three-day corporate finance class for executive MBAs that is only a mildly compressed version of my regular class and you can find the links to the webcasts for that class on my website.
The End Game
I know that some of you may wonder what the catch is and where I plan to hit you up for fees. While you search for my hidden agenda, I have only one request of you. If you find any of the material in these classes to be useful to you, rather than thank me for it, please pass the favor on, by helping someone else learn, understand or do something. Not only will you get far more out of this simple act of kindness than the person that you offer it to, but I hope that you will also get a sense of why teaching is its own reward.

YouTube Intro to Class


Class links (Spring 2016 MBA class)
  1. My website
  2. iTunes U
  3. YouTube Playlist
Lecture Notes for Class
  1. Syllabus and Project
  2. Lecture Note Packet 1
  3. Lecture Note Packet 2
 Book if you want it
  1. Applied Corporate Finance, 4th Edition (Warning: It is obscenely over priced but there is not much that I can do about it. Sorry!)

January 2016 Data Update 8: Pricing, with an end of month update

$
0
0

If you have been tracking the posts that I have about my data updates, you probably noticed that early on, I had planned eight posts but that this shrunk to seven by the time I was done. The reason was that the last post that I was planning to make was going to be on pricing numbers, i.e., the multiples that companies are trading at around the world, relative to book value and earnings. However, as the market dropped in January, I decided that posting the PE and EV/EBITDA multiples from January 1, 2016, would be pointless, since the numbers would be dated. I was also considering a post on the stock market turmoil during the month, and during the weekend, I decided that I could pull off a combined post, where I could look at both the pricing on January 1, and how it has changed during January 2016, by region, country and sector.

The US story, as told through the ERP
In my very first post this month, I looked at the equity risk premium for the S&P 500 on January 1, 2016, and estimated it to be 6.12%, based on dividends and buybacks over the last 12 months. I noted my discomfort with the fact that the cash returned in those twelve months exceeded the earnings, and estimated a buyback adjusted ERP of 5.16%, with buybacks reduced over time to a sustainable level. As in prior volatile months, I computed the ERP at the end of each trading day, using both measures of cash flows (trailing 12 months and modified to reflect earnings). The numbers are in the table below:
Download spreadsheet
The ERP rose about 0.60% (on both measures) during the month to peak on January 20, though it dropped back again in the last few days of the month. It is true that I left the cash flows and growth periods unchanged over the trading days, and that the bad news of the month may reverberate, with lower buybacks and growth expectations in the coming months. thus, the increase in the ERP is exaggerated, but, in my view, the bulk of the change will remain. The essence of a crisis month, like this one, is that the price of risk will increase during the month.

The Five Trillion Dollar Heist: Who did it?
The month started badly, with the Chinese markets dropping on the first trading day of the year and taking other markets down with them. Much of the month followed in the same vein, with extended periods of market decline followed by strong up days. Oil and China continued to be the market drivers, with oil prices continuing their inexorable decline and news of economic slowdown from China coming in at regular intervals. The damage inflicted during the month is captured in the chart below:


The global equity markets collectively lost $5.54 trillion in value during the month, roughly 8.42% of overall value. The global breakdown of value also reflects some regional variations, with Chinese equities declining from approximately 17% of global market capitalization to closer to 15%. To the question of how the month measures up against the worst months in history, the good news is that there have been dozens of months that delivered worse returns in the aggregate. In fact, the US equity market's performance in January 2016 would not even make the list of 25 worst months in US market history, all of which saw double-digit losses or worse or even the 50 worst month list. 

Whodunnit? Surveying the Regional Damage
As you can see in the pie chart, the pain was not inflicted equally across the world. China was the worst affected market and the details of the damage by region are captured in the table below. 

Country Performance Spreadsheet
Not only did mainland Chinese stocks lose more than 20% of their market capitalization, more than 75% of all stocks in that country dropped more than 10% and 59% dropped by more than 20%; Hong Kong listings fared a little better, but still managed to come in second in the race for worst regional market. Indian and Japanese stocks were hard hit, but the rest of Asia (small Asia) did not do as badly. Among the developed markets, Australia was the worst affected but the UK, US and EU regions saw market capitalizations drop by 6-7%. 

If you are a knee-jerk contrarian, you may be tempted to jump into the Chinese market, especially since mainland Chinese stocks traded at 15.73 times earnings, on January 31, 2016, down from 20.28 times earnings at the start of the month, and Hong Kong based Chinese stocks look even cheaper. In the global heat map below, you can look up how stock markets fared in each country during January 2016 and pricing multiples at which equities are trading at the end of the month. 


The Sector Effects
Just as the market damage varied across countries in January 2016, it also varied across industry groupings. Using my industry categorization, I looked at the change in market capitalizations, by industry, and key pricing multiples (PE, Price to Book, EV to EBITDA, EV to Invested Capital) at the start and end of January 2016. The entire list can be downloaded at this link, but the fifteen industries that fared the worst, in terms of drop in market capitalization, are listed below:

Industry Spreadsheet
The biggest surprise, given the news about continued drops in oil prices, is that none of the oil groupings (I have four) showed up on the list, with integrated oil companies dropping only 4.20%  and oil distribution companies dropping 8.93% during the month. Not surprisingly, there are a host of cyclical companies on this list, but biotech and electronics companies also suffered large drops in value. Looking at the fifteen industries that fared the best during the month, tobacco topped the list, as one of the three industries that managed to post positive returns, with utilities and telecom services being the other two. 
Precious metals did well, reflecting the tendency of investors to flee to them during crisis, but most of the rest of the list reflects industries that sell the essentials (food and household products, health care).

Where next?

As investors, we often feel the urge to extrapolate from small slices of market history, and I am sure that there will be some who see great significance in the last month's volatility. They will dredge up temporal anomalies like the January effect to explain why stocks are doomed this year and that if Denver wins the Super Bowl, it is going to be catastrophic for investors. I am not willing to make that leap. What I learned from January 2016 is that stocks are risky (I need reminders every now and then), that market pundits are about as reliable as soothsayers, that the doomsayers will remind you that they "told you so" and that life goes on. I am just glad the month is over!

Datasets
  1. ERP by day for the S&P 500 with ERP spreadsheet, if you want to do it yourself.
  2. Industry Price Performance (with multiples before and after)
  3. Country Price Performance 
Data Update Posts

A Violent Earnings Season: Pricing and Value Perspectives

$
0
0

The earnings season is upon us once again, the quarterly rite of passage where companies report their earnings results, the numbers get measured up against expectations, expectations get reset and prices adjust. As an investor, I sometimes find the process unsettling, but as a market observer, I cannot think of a better Petri dish to illustrate both the magic of markets and the vagaries of human behavior. This earnings season has been among the violent, in terms of market reaction, in quite a few years, as tens of billions of dollars in market capitalization have been wiped out overnight in some high flyers. In order to get perspective during these volatile times, it helps me to go back to a contrast that I have drawn before between the pricing and value games and how they play out, especially around earnings reports.

Price versus Value: The Information Effect
In finance, we use the words price and value, as if they were interchangeable and I have sometimes been guilty of this sin. It is worth noting that price and value not only come from different processes and are determined by different variables, but can also yield different numbers for the same asset at the same point in time. I try to capture the difference in a picture:


The essence of value is that it comes from a company's fundamentals, i.e., its capacity to generate and grow cash flows; you can attempt to estimate that value using accounting numbers (book value) or intrinsic valuation (discounted cash flow). Fundamental information causes changes in a company's cash flows, growth or risk and by extension, will change its value. Pricing is a market process, where demand and supply intersect to produce a price. While that demand may be affected by fundamentals, it is more immediately a function of market mood/sentiment and incremental information about the company, sometimes about fundamentals and sometimes not.

In an earlier post, I drew a distinction between investors and traders, arguing that investing is about making judgments on value and letting the price process correct itself, and trading is about making judgments on future price movements, with value not being in play. While the line between fundamental and incremental information is where the biggest battles between investors and traders are fought, it is not an easy one to draw, partly because it is subjective and partly because there are wide variations within each group on making that assessment. For instance, consider Apple, a company followed closely by dozens of analysts, and its earnings report on January 26, 2016. The company beat earnings expectations, delivering the most profitable quarterly earnings in corporate history, but also sold fewer iPhones than expected; the company lost almost $30 billion in market capitalization in the immediate aftermath. An investor valuing the company based on dividends would conclude that it was an overreaction, since not only are dividends not under immediate threat but the cash balance of $200 billion plus should allow the company to maintain those dividends in the  long term. A different investor whose valuation of the company was based on its operating cash flows might have viewed the same information as more consequential, especially since 65-70% of Apple's cash flows come from iPhones. A trader whose pricing of Apple is based on iPhone units sold would have drastically lowered the price for the stock, if his expectations for sales were unmet, but another trader whose pricing is based on earnings per share, would have been unaffected.

Earnings Reports: The Pricing and Value Reaction
While almost any story (rumor, corporate announcement) can be incremental information, it is quarterly earnings reports that keep the incremental information engine running, as revelations about what happened to a company in the most recent three-month period become the basis for reassessments of price and value.

Earnings Reports: The Pricing Game
The way traders react to earnings reports is, at least on the surface, uncomplicated. Investors form expectations about what an earnings report will contain, with analysts putting numbers on their expectations. The actual report is then measured up against expectations, and prices should rise if the actuals beat expectations and fall if they do not. The picture below captures this process, with potential complications thrown in.

While the game is about actual numbers and expectations, it remains an unpredictable one for three reasons. The first is that the price catalyst in the earnings report, i.e, whether the market reacts to surprises on management guidance, revenues, operating income or earnings per share, can not only vary across companies but across time for the same company. The second is that while analyst expectations are what we focus on and get reported, the market's expectations can be different. The third is that the effect on stock prices, for a given surprise (positive or negative) can be different for different companies and in different time periods.
  1. Price Catalyst: It is easy enough to say that if the actual numbers beat expectations, it is good news, but actual numbers on what? While earnings reports two decades ago might have been  focused almost entirely on earnings per share, the range of variables that companies choose to report, and investors react to, has expanded to not only include items up the income statement, such as revenues and operating income, but also revenue drivers which can include units sold, number of users and subscribers, depending on the company in question.  In the last decade, companies have also increasingly turned to providing guidance about key operating numbers in future quarters, which also get measured against expectations. Not surprisingly, therefore, most earnings reports yield a mixed bag, with some numbers beating expectations and some not. Thus, Apple's earnings report on January 26, 2016, delivered an earnings per share that was higher than expected but revenue and iPhone unit numbers that were lower than anticipated.
  2. Whose expectations? News stories about earnings reports, like this one, almost always conflate analyst estimates with market estimates, but that may not always be correct. It is true that analysts spend a great deal of their time working on, finessing and updating their forecasts for the next earnings report, but it is also true that most analysts bring very little new information into their forecasts, are overly dependent on companies for their news and are more followers than leaders. To the extent that companies play the earnings game well and are able to beat analyst forecasts most or even in all quarters, the market seems to build this behavior into a "whispered earnings" number, which incorporates that behavior. 
  3. Effect of surprise: The market reaction to a surprise is also unpredictable, passing through what I call the market carnival or magic mirror, which can distort, expand or shrink effects, and three factors come into play in determining that image. The first is the company's history on on delivering expected earnings and providing guidance. Companies that have consistently delivered promised numbers and provided credible guidance tend to be cut more slack by markets that those that have a history of volatile numbers or stretching the truth. The second is the investor base acquired by the firm, with the mix of investors and traders determining the price response. On a pricing stock, it is traders who dominate the action and the market response is therefore usually more volatile, whereas on a value stock, it is investors who drive a more muted market reaction. The third has less to do with the company and more to do with the market mood. In a month like the last one, when fear is the dominant emotion, good news is oft overlooked or ignored, bad news is highlighted and magnified and the price reaction will tilt negative.
Earnings Reports: The Value Game
It is difficult to characterize the value game, precisely because it is played so differently by its many proponents. Some old-time value investors' concept of value is tied to dividends and other value investors are more open to expanding their measures of cash flows. To me, the one area where there should be agreement across investors is that every good intrinsic valuation should be backed by a narrative that not only provides structure to the numbers in the valuation, but also provides them with credibility. As I noted in this post from August 2014, it is this framework that I find most useful, when looking at earnings reports and I capture the "value" effect of earnings reports in this picture:

If you accept the notion that value changes when your narrative changes, the following propositions follow:
  1. An earnings report can cause big change in value: For an earnings report to significantly affect value, a key part or parts of the narrative have to be changed by an earnings report. This could be news that a company has entered and is growing strongly in a market that you had not expected it to be successful in or on the flip side, news that the market that you see it is in is smaller and/or growing less than anticipated. 
  2. Big value changes are more likely in young companies: These significant shifts in value are more likely to occur with young companies than where business models are still in flux than with more established firms. Consequently, you should not be too quick in classifying a big price move on an earnings report as a market overreaction, especially with young firms like GoPro and Linkedin.
  3. There is more to an earnings report than the earnings per share: The relentless focus on earnings per share can sometimes distract investors from the real news in the earnings report which can be embedded in less publicized numbers on product breakdown, geographical growth or cost patterns.
If you believe, like I do, that investing requires you to constantly revisit and revalue the companies that you have or wish you to have in your portfolio, new earnings reports from these companies provide timely reminders that no valuation is timeless and no corporate narrative lasts forever.

The Rest of the Story
This post has gone on long enough, but it will be the first in a series that I hope to do around earnings reports, built around four topics.
  1. Make it real: In the first set of posts, I will be looking at a few companies that I have valued before. I will start by looking at two companies, dueling for the honor of being the largest market cap company in the world, Alphabet (Google) and Apple, seemingly on different trajectories at the moment. I will follow up with Amazon and Netflix, two firms that are revolutionizing the entertainment business and were among the very best stocks to invest in last year. In the third post, I will turn my attention to two social media mainstays, one of which (Facebook) has unlocked the profit potential of its user base and the other (Twitter) that has (at least so far) frittered away its advantages. In the final post, I plan to pay heed to two high flyers, GoPro and Linkedin, that have hit rough patches and lost large portions of their value, after recent earnings reports.
  2. The Players: In the second set of posts, I will first focus on investors and traders and how they might be able to play the earnings game to their advantage, often using the other side as foil. I will then examine how corporations can adapt to the earnings game and look at different strategies that they use for playing the game, with the pluses and minuses of each. 
  3. The Government/Regulators/Society: In the final post, I will play a role that I am uncomfortable with, that of market regulator, and examine whether as regulator, there is a societal or economic benefit to trying to manage how and what companies report in their earnings reports and the investor reaction to these reports. In the process, I will look at the debate on whether the focus on delivering quarterly earnings diverts companies from a long term focus on value and how altering the rules of the game (with investor restrictions and tax laws) may make a difference.
YouTube Video


Blog posts in this series
  1. A Violent Earnings Season: The Pricing and Value Games
  2. The Race to the Top: Apple and Alphabet 
  3. The Disruption of Entertainment: Amazon and Netflix 
  4. Management Matters: Facebook and Twitter
  5. The Icarus Effect: LinkedIn and GoPro
  6. Investor or Trader? Finding your place in the Value/Price Game!
  7. The Perfect Investor Base? Corporation and the Value/Price Game
  8. Taming the Market? Rules, Regulations and Restrictions


Race to the top: The Duel between Alphabet and Apple!

$
0
0

Apple and Alphabet, the two companies jockeying for the  prize of “largest market cap company in the world” are both incredibly successful businesses, with unparalleled cash machines (the iPhone and Google Search) at their core. That said, the last month has been eventful for both companies, just as it has for the rest of the market, as their latest earnings reports seem to suggest that these firms are on divergent paths. Having valued Apple multiple times on this blog over the last five years, and bought and sold the stock based on those valuations, the most recent earnings report is an opportune time for me to revisit Apple’s value. Having never valued Alphabet on this blog, though I have valued it in my classes multiple times, its earnings report is a good time to initiate the process with a valuation.

The Apple Rollercoaster
Apple’s most recent earnings report came out on January 26, 2016, and it contained mixed news. On the good news front, Apple announced the largest quarterly earnings in corporate history and higher earnings per share than expected by analysts. The bad news was that these earnings were generated on revenues that were close to flat for the year, that iPhone sales were lower than expected and that the management expected revenues to stay weak through next quarter (in its guidance). The market’s reaction was negative, with Apple’s stock declining by 6.57%, a drop in market capitalization of more than $30 billion, right after the announcement. In the picture below, I capture the pricing reaction to Apple, with its earnings history as background information:

In summary, it looks like the market is weighing the iPhone and guidance bad news far more than the earnings good news in making its assessment, with Apple's history of beating earnings every quarter for the last eight weighing against it.

To evaluate whether the earnings report merited the negative market reaction, I went back to the intrinsic value drawing board and updated my valuation of Apple, the last of which I posted in August 2015 and subsequently updated in November 2015, after its annual report (with a September 2015 year end) came out. My assessment of Apple’s value in November of 2015 was $134/share, but more importantly, the narrative that I had for Apple was that of a slow-growth , cash rich company (revenue growth rate of 3% in the next five years and a cash balance of $200 billion), with operating margins under pressure (declining from the 32.03% it earned as a pre-tax operating margin in the 2015 fiscal year to 25% over the next decade) and a very low probability of a difference-making disruption. Looking at the earnings report, it is true that revenue growth came in below expectations (but not by much, given my low expectations) and operating margins dropped, again in line with expectations.

The net effect is that  my narrative changed little, and using a slightly lower revenue growth rate (2.2% instead of 3%) leads me to an updated assessment of value per share of $126 in February 2016 and almost all of the difference is coming from a repricing of risk (higher equity risk premiums and default spreads in the market). In keeping with my view that estimated value is a distribution, not a single number, I ran a simulation on Apple's value in February 2016:

At the price of $94 at close of trading on February 12, 2016, Apple looks under valued by about 25% and at least based on my distribution, there is a more than 90% chance that it is under valued.

Alphabet Soup
Alphabet surprised markets on February 1, 2016, with on earnings report where the company reported higher revenue growth than anticipated, coupled with higher profit margins. Since it was also the first report that the company was releasing as holding company, where it was breaking itself down  by business, there was also excitement about what you would learn about the company from this report. As with Apple, I start by looking at the pricing effect of the earnings report, comparing, actual numbers to expectations and tallying the stock price reaction to the report:

Markets were impressed by both the revenue and earnings numbers and the stock price increased by 8% in the immediate aftermath, briefly leading Alphabet to the front of the market cap race.

As a counter to the market's excitement, I decided to compare the narrative (and value) that I had for Alphabet in November 2015 (after their last earnings report) to the narrative (and value) after this one (in February 2016).  In November 2015, my narrative for Google was that it would continue to be a dominant and profitable player in a growing online advertising market, growing 12% a year in the near term, maintaining its operating margins (left at 30% in pre-tax terms, in perpetuity).

It is true that in their most recent earnings report, Alphabet reported double-digit growth in revenues (impressive given their size and the state of the global economy) and higher operating margins than they did in the previous quarter. I left my original narrative largely intact, with revenue growth remaining at 12% and pushed up the target pre-tax operating margin to 32%, and arrived at a value per share of $631/share. Presenting Google's value as a distribution, here is what I get:

At $682.40, the price at which the class C shares were trading at on February 12, 2016, the stock is trading at about 8% above the median price, with a 35% chance of being under valued. Since these shares have no voting rights, attaching a value to voting rights, will make the shoes a little more over priced.

I know that one reason for Google's restructuring/renaming exercise last year was an ostensible desire to improve transparency, but I think that there may be less here than promised, at least at the moment. There were a few things that became transparent in Google's last earnings release, as captured in this picture of a key part of the earnings release from the company:
  1. It became transparently obvious that Google is almost entirely an online advertising company. All of Google's other businesses generate collective revenues of $448 million, while reporting operating losses of $3,567 million. To even call them businesses is perhaps stretching the definition of the word "business", since all they do well, right now, is spend money. While it is reasonable to cut them some slack because they are young, start-ups, there is nothing in this report that would lead you to think about them any differently than you always have, if you were a Google-watcher.
  2. It is transparently clear that in spite of its technological sophistication, this company uses financial terms loosely.  Note that what the company reports in its earnings release as operating income of $23,245 million in the 2015 fiscal year is really EBITDA, and perhaps the only thanks that we can give is that it is not an adjusted EBITDA. If you are going to be transparent, it is best if you not follow the dictum of Humpty Dumpty in Alice in Wonderland, and claim that a "word is what you choose it to mean".
    Transparency is good for investors, but with Alphabet, I will reserve my cheers until I see real evidence of it (and perhaps I will, in the full 10Q).

    Apple vs Alphabet
    If this were a boxing match, Apple and Alphabet would be the super heavyweights, fighting it out for the world championship. To judge which is the better company, though, you would have to specify on what dimension you are making the comparison, i.e., as a business, an investment or as a trade.

    I. As Businesses
    Apple and Alphabet share a few common features. First, each of them derives their value from one cash cow, the iPhone for Apple and the search engine for Google, that individually have values so large that they would exceed the GDPs of many small countries. Second, both companies are known for their attention to detail and customer focus, at least on their core products, perhaps explaining why they have been so successful over time. Third, both companies have work forces filled with brilliant people who seem to like working for them. In short, these companies are perfect illustrations of how customer focus, employee satisfaction and shareholder value maximization often go hand in hand.

    Each company, though, has areas where it has advantages. The Alphabet advantage is that its core product, its search engine, enriched with YouTube and the Google ecosystem, requires less care and maintenance to keep cash flows going, with Facebook perhaps being the only threat in the short or the medium term to profits. In contrast, Apple's iPhone franchise requires the company to constantly reinvent the product and make its own prior models obsolete, creating a two-year cycle that is both expensive and gut wrenching to watch. The Apple advantage, though, comes from its history of having survived a near-death experience (in the late 1990s) and reinvented itself. Consequently, the company is much more aware of how tenuous its hold on value is and it does try harder to find new game changers. There is one final difference that, at least at the moment, is working for Alphabet and against Apple, which is that Apple has made China its biggest foreign bet and Google has little exposure to the Chinese economy, thanks to the Chinese government's fear that all that stands between it and chaos is a good search engine.

    If I were to pick a better business at the moment, it has to be Google. The company's core is strong and will get stronger and the biggest threat it faces, i.e., that the way we look for things may change from search engines to social media sites, is more distant that the the one faced by Apple.

    II. As an Investment
    The quality of an investment does not always correlate with its quality as a business, with the price driving the divergence. Buying a great business at too high a price is a bad investment, just as buying a bad business at a low enough price can be a good investment. Both Apple and Alphabet are good businesses, but as an investor, my money is on Apple, rather than Alphabet, at the prevailing price:
    1. The break even points for the two companies to be fairly priced are wildly divergent. Apple does not need any revenue growth and can see its operating margins slashed by a third and it would still be a fairly valued investment at its current price. Google will have to deliver 12% revenue growth with its current already high pre-tax operating margin to break even. 
    2. This may just reflect my personal predilections, but I need a bonus to invest in a company that wants my money but is not interested in my input (my vote on key decisions). I have had my disagreements with Tim Cook, but Apple is a much stronger corporate democracy than Alphabet, which remains a dictatorship, albeit a benevolent one (at the moment). 
    I would hasten to add that I have never owned Google, as an investor, and that may reflect the fact that I continually under estimate the profit-making power of its online advertising engine. So, feel free to download my valuation, change the inputs you don't like and make it your own.

    III. As a Trade
    If momentum is the biggest driver in the pricing game, it is Alphabet that has the advantage right now, notwithstanding the decline in its price in the days since its last earnings report. Whether fair or not, markets have found the good news in almost every Alphabet story and find the storm clouds even on Apple's sunniest days. As long as the momentum game continues, you will make money far more easily and quickly with Alphabet than with Apple, but just a note of warning, from Apple's own recent past. Momentum will change, almost always without any advance warning and for no good fundamental reason, and when it does, I hope that you are able to get ahead of it.

    YouTube


    Raw Data
    1. Apple Last 10K (September 2015) and Current 10Q (December 2015)
    2. Google Last 10K, Last 10Q and Earnings Release (no current 10Q at the time of post)
    Spreadsheets
    1. Valuation of Apple in November 2015 and February 2016
    2. Valuation of Alphabet (Google) in November 2015 and February 2016
    Blog posts in this series
    1. A Violent Earnings Season: The Pricing and Value Games
    2. Race to the top: The Duel between Alphabet and Apple!
    3. The Disruption of Entertainment: Amazon and Netflix 
    4. Management Matters: Facebook and Twitter
    5. The Icarus Effect: LinkedIn and GoPro
    6. Investor or Trader? Finding your place in the Value/Price Game!
    7. The Perfect Investor Base? Corporation and the Value/Price Game
    8. Taming the Market? Rules, Regulations and Restrictions

      The Disruptive Duo: Amazon and Netflix!

      $
      0
      0

      Amazon and Netflix! Need I say more? Just the mention of those companies cleaves market participants into opposing camps. In one camp are those who believe that those who invest in these companies are out of their minds and that there is no way that you can justify buying these companies, perhaps at any price. In the other are those who argue that the old time value investors don't get it,, that these companies are redefining old businesses and will emerge as winners, thus justifying their high prices. The truth, as always, lies in the middle.


      Amazon and Netflix: Reading the Pricing Entrails

      Amazon and Netflix have been market wonders, rising in market capitalization even in 2015, a year when most of the market was retrenching. Notwithstanding the steep drop in stock prices of both companies this year (with Amazon down 23% and Netflix down 22%), Amazon is still up 36% over the last year and Netflix is up 34% during the same period.


      One simple way to measure how much these companies have to come to dominate their playing fields is to compare them with traditional heavyweights in their businesses, Walmart, in the case of Amazon, and Time Warner, in the case of Netflix.


      Is it possible that Amazon is worth more than Walmart and that Netflix is more than 60% of Time Warner’s value? The answer is yes and the only way to find out is by valuing both companies.

      Amazon: The Field of Dreams Company

      In a post in October 2014, I described Amazon as a Field of Dreams company, with a CEO (Jeff Bezos) who has been remarkably consistent in his push to make the company larger, even if that means selling products and services at cost, or even below, with the objective of using that market power to generate profits later. His vision for the company can be seen in this 1997 letter to stockholders and the company has certainly delivered on at least one half of that vision and increased its revenues in retailing initially, entertainment later and cloud computing recently, while generating little in profits over much of its existence.

      In its most recent earnings report on January 28, 2016, Amazon delivered its by-now-usual high revenue growth, delivered close to expected numbers on its revenues and guidance, but came in well below expectations on its earnings per share. 


      The market reacted strongly to the earnings per share surprise, with the stock price dropping 15% and Amazon losing $45 billion in market capitalization. The response followed a pattern of large market reactions to earnings surprises at the company, perhaps suggesting that the market is dreaming less about revenues and wanting more in profits from Amazon.

      From a valuation perspective, Amazon’s results reinforced my existing story, with perhaps a tweak in the pathway to profitability:

      During the last year, Amazon has taken actions that suggest that it is heeding the call to show profits, shifting more of its focus to cloud computing and laying off employees for the first time in its corporate life. To get a measure of the company’s current and expected future profit margins, I decided to take Amazon’s substantial technology and product development costs, which amounted to $12.5 billion in 2015 out of the operating expenses, and capitalize them, on the rationale that as growth started to slow, the growth in this cost would level off. That adjustment does push the current operating margin for the company from 2.09% to 6.58%, while also significantly raising my estimates of how much Amazon is reinvesting to generate its high revenue growth. Assuming that there is still room for revenue growth (especially in Amazon’s media and cloud computing business) and margin expansion (to 8.80%, the weighted average of the margins in the retail, media and cloud business) gives me an updated story for Amazon. The value that I obtain is $323.55 per share and the results of the simulation in February 2016 using this updated story are below:

      Amazon Valuation Spreadsheet
      At $507 per share, the price on February 12, 2016, Amazon still looks over valued to me, but as you can see from the simulation, there is a sizeable probability that assuming higher growth and higher margins can get you values that exceed the price. If your rationale for buying Amazon is the cloud computing dream, I would suggest caution. The business is a big, potentially profitable one, but it is also one where other big players are stirring.

      Netflix: House of Cards or Global Streamer?
      Like Amazon, Netflix has a CEO in Reed Hastings, who has been both consistent and credible in selling a story of growth and potential. As the company approaches saturation in the US market, the growth story has a global twist to it. In its earnings report on January 19, 2016, Netflix beat expectations on both earnings per share and subscribers, with the growth in global subscribers tipping the scale. 

      While the report initially evoked a positive response, that price bounce quickly faded as investors took profits.

      I have never posted a Netflix valuation on my blog, but in my prior valuations of the firm, I have tended to value it as a primarily domestic company that acquires others’ content and streams it to subscribers While that remains the core business model, it seems to me that the story is shifting to a company that is increasingly global and more willing to generate its own content, with this earnings report providing further backing for the view. The connection between this story and my valuation inputs is below:

      Note that Netflix’s shift to content has mixed effects, decreasing profit margins (at least as I have defined them) while also reducing the reinvestment needed to generate growth (as the cost of buying content is replaced with the cost of making its own). The value per share that I obtain with these inputs is $61.44. Allowing the inputs to vary and be drawn from distributions, my estimated value distribution for Netflix is as follows:


      At $87.40/share per share, Netflix looks overvalued by about 40%, but as with Amazon, there are clearly combinations of revenue growth and margins that yield values that exceed the price.

      To GAAP or not to GAAP?

      Both Amazon and Netflix have a GAAP problem, insofar as neither company generates much in operating profits, using conventional accounting rules. I do believe that GAAP understates the profits at both companies, though not for the reasons used by many of the biggest cheerleaders for the company, including the adding back of stock-based compensation or the use of supplier credit as a source of capital (and cash flows). The problem is in the accounting categorization of expenses, with Amazon’s big investments in technology and content and Netflix’s even bigger spending on acquiring the rights to content (usually for multiple years) being treated as operating expenses. If we following accounting’s own first principle, which define capital expenditures as expenditures designed to create benefits over many years, Amazon’s technology investments and Netflix’s content commitments should both be moved out of operating expenses and the effects are captured in the table below:


      In summary, reclassifying these basic expenses changes the picture of these companies from low margin companies, that grow revenues with very little reinvestment, to higher margin companies, that reinvest significant amounts to deliver higher revenues. It also has a favorable impact on value per share, not because of the obvious reasons (that operating income is increased) but because the reinvestment at both companies has been value-generating.

      I don't worship at the GAAP altar and have come to the conclusion that while accountants might do some things well, measuring earnings at companies that are not stable, manufacturing firms is not one of those things.  They not only violate their own first principles (as evidenced by the treatment of R&D and contractual commitments as operating expenses) but also create inconsistencies across companies, making earnings at Amazon and Netflix not quite comparable with the earnings at GM or even at Walmart. That is one reason that I give short shrift to arguments against investing in Amazon, because it trades at several hundred times earnings, since cutting its technology development costs by $10 billion could quickly solve that PE problem while destroying the basis for the company's value.

      As businesses, the two companies share a common characteristic: they are willing to spend money now (on Prime and technology, in the case of Amazon, and original and acquired content, in the case of Netflix) to generate revenue growth, which they believe that they can turn into positive cash flows later. Both companies also realize that their growth ambitions will require them to grow outside the US, in less friendly regulatory standpoint and competitive environments. The biggest danger that the two companies face is that their revenue growth plans come to fruition, but that their costs stay high, as they have to keep spending money to keep their customers. There is one other characteristic that they share and it is one that may add to their value, though it is disquieting, at least to me. I have a feeling that Amazon knows more about my buying habits, and Netflix about my TV and movie watching proclivities, than I do myself. As an Amazon Prime user and Netflix subscriber of long standing, I know that they will use this knowledge to draw me deeper into their web, but I must confess that I am going in willingly.

      Investor or Trader?

      In the first post in this series, I differentiated between investors and traders and no two companies better illustrate the divide than Amazon and Netflix. The two stocks have created a Rorschach test  by forcing you to choose between staying true to your investing beliefs or capitulating to your pricing instincts. I would be lying if I said that I have not revisited my Amazon valuation from October 2014, when the stock was trading at about $300 and I found it to be over valued, as the stock doubled to more than $600 during the course of the next year or that I have not looked wistfully at Netflix, during its stock price rise last year.  That said, I have made my peace, for the moment, with the market, on these companies. I am an investor, for better or worse, and have to go with my estimates of value, flawed thought they might be, and will not buy either Amazon or Netflix, at their current prices. At the same time, I have enough respect for the power of markets to not sell short on either stock, since I have seen what momentum can do with both stocks. You can call me chicken, but I don't have the luxury of investing other people's money!
      YouTube


      Datasets
      1. Amazon 10K (2015)
      2. Netflix 10K (2015)
      Spreadsheets
      1. Amazon - Valuation in February 2016
      2. Netflix - Valuation in February 2016
      Blog posts in this series
      1. A Violent Earnings Season: The Pricing and Value Games
      2. Race to the top: The Duel between Alphabet and Apple!
      3. The Disruptive Duo: Amazon and Netflix 
      4. Management Matters: Facebook and Twitter
      5. The Icarus Effect: LinkedIn and GoPro
      6. Investor or Trader? Finding your place in the Value/Price Game!
      7. The Perfect Investor Base? Corporation and the Value/Price Game
      8. Taming the Market? Rules, Regulations and Restrictions


      Management Matters: Facebook and Twitter!

      $
      0
      0

      I am not a big user on social media. I have a Facebook page, which I don’t visit often, never respond to pokes and don’t post on at all. I tweet, but my 820 lifetime tweets pale in comparison to prolific tweeters, who tweet that many times during a month. That said, I have been fascinated with, and have followed, both companies from just prior to their public offerings and not only have learned about the social media business but even more about my limitations in assessing their values. The paths that these companies have taken since their public offerings also offer illustrative examples of how markets assess and miss-assess these companies, why management matters, and the roller coaster ride that investors have to be willing to take, when they make bets on these companies.


      Facebook
      In its brief life as a public company, Facebook has acquired a reputation of being a company that not only manages to make money while it grows but is also able to be visionary and pragmatic, at the same time. In its most recent earnings report on January 27, 2016, Facebook delivered its by-now familiar combination of high revenue growth, sky high margins and seeming endless capacity to add to its user base and more importantly, monetize those users:


      The market’s reaction to this mostly positive report was positive, with the stock rising 14% in the after market.

      I first valued Facebook a few weeks ahead of its IPO and again at the time of its IPO at about $27/share, laughably low, given that the stock is close to $100 today, but reflecting the concerns that I had on four fronts: whether it could keep user growth going, given that it was already at a billion users then, whether it could make the shift to mobile, as users shifted from computers to mobile phones and tablets, whether it could scale up its online advertising revenues and whether it could continue to earn its high margins in a business fraught with competition. The company, through the first four years of its existence has emphatically answered these questions. It has managed to increase its user base from huge to gargantuan, it has made a successful transition to mobile, perhaps even better than Google has, and it has been able to keep its unusual combination of revenue growth and sky-high margins. Prior to the prior year's last earnings report, in November 2015, I was already seeing Facebook as potentially the winner in the online advertising battle with Google and capable of not only commanding a hundred billion in revenues in ten years but with even higher margins than Google. The value per share of almost $80/share, that I estimated for the company in November 2015, reflects the steady rise that I have reported in my intrinsic value estimates for the company over the last five years. If anything, the story is reinforced after the earnings report, with revenue growth coming in at about 44% and an operating margin of 51.36%.

      The value per share that I get for the company, with this narrative, is about $95/share, just a little bit under the $102/share that the stock was trading at in February 2016.  As with my other valuations in this series, I ran a simulation of Facebook’s value and the results are below:
      At the prevailing price of $102/share, the stock was close to fairly priced on February 12, at least based on my inputs. 

      I am sure that there will be others who will put Facebook under a microscope to find its formula for success, but there are two actions that are illustrative of the company’s mindset. The first was its afore-mentioned conquest of the mobile market, where it badly lagged its competitors at the time of it IPO. Rather than find excuses for its poor performance, the company went back to the drawing board and created a mobile version which not only improved user experience but provided a platform for ad revenues. The second was the company’s acquisition of Whatsapp, an acquisition that cost the company more than $20 billion and provoked a great deal of head scratching among value minded people at time, since Whatsapp had little in revenues and no earnings at the time. I argued at the time that the acquisition made sense from a pricing perspective, since Facebook was buying 450 million Whatsapp users for about $40/user, when the market was pricing these users at $100/user. That acquisition may have been driven by pricing motivations but it has yielded a value windfall for the company, especially in Asia and Latin America, with more than 100 million Whatsapp users just in India. 

      It is true that Facebook’s latest venture in India, Free Basics, where it had partnered with an Indian telecom firms to offer free but restricted internet service, has been blocked by the Indian government, but it is more akin to a bump in the road than a major car wreck. At the risk of rushing in where others have been burned for their comments, I am cynical enough to see both sides of the action. Much as Facebook would like to claim altruistic motives for the proposal, the restriction that the free internet use would allow you access only to the portion of the online space controlled by Facebook makes me think otherwise. As for those who opposed Free Basics, likening Facebook’s plans to colonial expansion is an over reach. In my view, the problem with the Indian government for most of the last few decades is not that it's actions are driven by knee jerk anti-colonialism, but that it behaves like a paternalistic, absentee father, insisting to its people that it will take care of necessities (roads, sewers, water, power and now, broadband), while being missing, when action is needed.

      On a personal note, I was lucky to be able to buy Facebook a few months after it went public at $18, but before you ascribe market timing genius to me, I sold the stock at $45. At the time, Tom Gardner, co-founder of Motley Fool and a person that I have much respect for, commented on my valuation  (on this blog) and suggested that I was under estimating both Facebook's potential and its management. He was right, I was wrong, but I have no regrets!

      Twitter
      If Facebook is evidence that you can convert a large social media base into a business platform to deliver advertising and more, Twitter is the cautionary note on the difficulties of doing so. Its most recent earnings report on February 10, 2016, continued a recent string of disappointing news stories about the company:


      The market reacted badly to the stagnant user base (though 320 million users is still a large number) and Twitter’s stock price hit an all time low at $14.31, right after the report.

      As with Facebook, I first valued Twitter in October 2013, just before its IPO and arrived at an estimate of value of 17.36 per share. My initial narrative for the company was that it would be successful in attracting online advertising, but that its format (the 140 character limit and punchy messages) would restrict it to being a secondary medium for advertisers (thus limiting its eventual market share).The stock was priced at $26, opened at $45 and zoomed to $70, largely on expectations that it would quickly turn its potential (user base) into revenues and profits. However, in the three years since Twitter went public, it is disappointing how little that narrative has changed. In fact, after the most recent earnings report, my narrative for Twitter remains almost unchanged from my initial one, and is more negative than it was in the middle of last year.


      Since the narrative has not changed since the original IPO, the value per share for Twitter, not surprisingly, remains at about $18. The results of my simulation are below:

      My estimate of value today is lower than my valuation in August of last year, when I assumed that the arrival of Jack Dorsey at the helm of the company, would trigger changes that would lead to monetization of its user base.

      So what’s gone wrong at Twitter? Some of the problems lie in its structure and it is more difficult to both attract advertising and present that advertising in a non-intrusive way to users in a Tweet stream. (I will make a confession. Not only do I find the sponsored tweets in my feed to be irritating, but I have never ever felt the urge to click on one of them.) Some of the problems though have to be traced back to the way the company has been managed and the choices it has made since going public. In my view, Twitter has been far too focused on keeping Wall Street analysts happy and too little on building a business. Initially, that strategy paid off in rising stock prices, as analysts told the company that the game was all about delivering more users and the company delivered accordingly. The problem, though, is that users, by themselves, were never going to be a sufficient metric of business success and that the market (not the analysts) transitioned, in what I termed a Bar Mitzvah moment, to wanting to see more substance, and the company was not ready. 

      Can the problems be fixed? Perhaps, but time is running out. With young companies, the perception of being in trouble can very easily lead to a death spiral, where employees and customers start abandoning you for greener pastures. This is especially true in the online advertising space, where Facebook and Google are hungry predators, consuming every advertising dollar in their path. I have said before that I don’t see how Jack Dorsey can do what needs to be done at Twitter, while running two companies, but I am now getting to a point where I am not sure that Jack Dorsey is the answer at Twitter.  As someone who bought Twitter at $25 late last year, I am looking for reasons to hold on to the stock. One, of course, is that the company may be cheap enough now that it could be an attractive acquisition target, but experience has also taught when the only reason you have left for holding on to a stock is the hope that someone will buy the company, you are reaching the bottom of the intrinsic value barrel. The best that I can say about Twitter, at the moment, is that at $18/share, it is fairly valued, but if the company continues to be run the way it has for the last few years, both price and value could move in tandem to zero. Much as I would like to hold on until the stock gets back to $25, I am inclined to sell the stock sooner, unless the narrative changes dramatically.

      The Postscript
      Valuing Facebook and Twitter after valuing Alphabet is an interesting exercise, since all three companies are players in the online advertising space. At their current market capitalization, the market is pricing Facebook and Google to not just be the winners in the game, but pricing them to be dominant winners. In fact, the revenues that you would need in ten years to justify their pricing today is close to $300 billion, which if it comes entirely from online advertising, would represent about 75% of that market. If you are okay with that pricing, then it is bad news for the smaller players in online advertising, like Twitter, Yelp and Snapchat, who will be fighting for crumbs from the online advertising table. This is a point that I made in my post on big market delusions last year, but it leads to an interesting follow up. If you are an investor, I can see a rationale for holding either Google or Facebook in your portfolio, since there are credible narratives for both companies that result in them being under valued. I think you will have a tougher time justifying holding both, unless your narrative is that the winner-take-most nature of the game will lead to these companies dominating  the online advertising market and leaving each other alone. If  Google, Facebook and the smaller players (Twitter, Yelp, a private investment in Snapchat) are all in your portfolio, I am afraid that I cannot see any valuation narrative that could justify holding all of these companies at the same time.

      Closing on a personal note, I have discovered, during the course of valuation, that I learn as much about myself as I do about the companies that I value. In the case of Facebook and Twitter, I have learned that I hold on to my expectations too long, even in the face of evidence to the contrary, and that I under estimate the effect of management, especially at young companies to deliver surprises (both positive and negative). I sold Facebook too soon in 2013, because my valuations did not catch up with the company’s changed narrative until later and perhaps bought Twitter too early,  last year, because I thought that the company’s user base was too valuable for any management to fritter away. I live and I learn, and I am sure that I will get lots of chances to revisit these companies and make more mistakes in the future.

      YouTube Video


      Datasets
      1. Facebook 10K (2015)
      2. Twitter - Bloomberg Summary (including 2015 numbers)
      Spreadsheets
      1. Facebook - Valuation in February 2016
      2. Twitter - Valuation in February 2016
      Blog posts in this series
      1. A Violent Earnings Season: The Pricing and Value Games
      2. Race to the top: The Duel between Alphabet and Apple!
      3. The Disruptive Duo: Amazon and Netflix 
      4. Management Matters: Facebook and Twitter
      5. The Icarus Effect: LinkedIn and GoPro
      6. Investor or Trader? Finding your place in the Value/Price Game!
      7. The Perfect Investor Base? Corporation and the Value/Price Game
      8. Taming the Market? Rules, Regulations and Restrictions

      Lazarus Rising or Icarus Falling? The GoPro and LinkedIn Question!

      $
      0
      0

      As I watch GoPro and LinkedIn, two high flying stocks of not that long ago, come back to earth my mind is drawn to two much-told stories. The first is the Greek myth about Icarus, a man who had wings of feathers and wax, but then soared so high that the sun melted his wings and he fell the earth. The other is that of Lazarus, who in the biblical story, is raised from the dead, four days after his burial. As investors, the decision that we face with GoPro and LinkedIn is whether like Icarus, they soared too high and have been scorched (perhaps permanently) or like Lazarus, they will come back to life.

      GoPro: Camera, Smart Phone Accessory or Social Media Company?
      GoPro went public in June 2014 at $24/share and quickly climbed in the months following to hit $93.85 in October of that year. When I first valued the company in this post, the stock was still trading at more than $70/share. Led by Nick Woodman, a CEO who had a knack for keeping himself in the public eye (not necessarily a bad thing for publicity seeking start up), and selling an action camera that was taking the world by storm, the company’s spanning of the camera, smartphone accessory and social media businesses seemed to position it to conquer the world. Even at its peak, though, it was clear the competitive storm clouds were gathering as other players in the market, noting GoPro’s success, readied their own products.

      In the last year, GoPro lost much of its luster as its product offerings have aged and sales growth has lagged expectations. It is a testimonial to these lowered expectations that investors were expecting revenues to drop, relative to the same quarter in the prior year, in the most recent quarterly earnings report from the company.

      The company reported that it not only grew slower and shipped fewer units than expected in the most recent quarter, but also suggested that future revenues would be lower than expected. While the company’s defense was that consumers were waiting for the new GoPro 5, expected in 2016, investors were not assuaged. The stock dropped almost 20% on the news, hitting an all-time low of $9.78, right after the announcement.

      To evaluate how the disappointments of the last year have impacted value, I went back to October 2014, when I valued the stock at $30.57. Viewing it as part camera, part smart phone and part social media company (whose primary market is composed of hyper active, over sharers), I estimated that it would be able to grow its revenues 36% a year, to reach about $10 billion in steady state, while earning a pre-tax operating margin of 12.5%. Revisiting that story, with the results in the earnings reports since, it looks like competition has arrived sooner and stronger than anticipated, and that the company’s revenue growth and operating margins will both be more muted.

      In my updated valuation, I reduced my targeted revenues to $4.7 billion in steady state, my target operating margin to 9.84% (the average for electronics companies) and increased the likelihood that the company will fail to 20%. The value per share that I get with my updated estimates is $17.66, 35% higher than the price per share of $12.81, at the start of trading on February 22, 2016.  Looking at the simulation of values, here is what I get:
      Spreadsheet with valuation
      At its price of $12.81, there is a 68% chance that the stock is under valued, at least based on my assumptions.

      I am fully aware of the risks embedded in this valuation. The first is that as an electronics hardware company that derives the bulk of its sales from one item, GoPro is exposed to a new product that is viewed as better by consumers, and especially so if that new product comes from a company with deep pockets and a big marketing budget; a Sony, Apple or Google would all fit the bill. The second is that the management of GoPro has been pushing a narrative that is unfocused and inconsistent, a potentially fatal error for a young company. I think that the company not only has to decide whether its future lies in action cameras or in social media and act accordingly, but it also has to stop sending mixed messages on growth; the stock buyback last year was clearly not what you would expect from a company with growth options.

      Linkedin: The Online Networking Alternative?
      LinkedIn went public in May 2011, about a year ahead of Facebook and can thus be viewed as one of the more seasoned social media companies in the market. Like GoPro, its stock price soared after the initial public offering:

      LinkedIn Stock Price: IPO to Current
      While it often lumped up with other social media companies, Linkedin is different at two levels. The first is that it is less dependent on advertising revenues than other social media companies, deriving almost 80% of its revenues from premium subscriptions that it sells its customers and from matching people up to jobs. The second is that its pathway to profitability has been both less steep and speedier than the other social media companies, with the company reporting profits (GAAP) in both 2013 and 2014, though they did lose money in 2015.

      Unlike GoPro, where expectations and stock prices had been on their way down in the year before the most recent earnings report, the most recent earnings report was a surprise, though, at least at first sight, it did not include information that would have led to this abrupt a reassessment:
      Linkedin delivered earnings and revenue numbers that were higher then expectations and much of the negative reaction seems to have been to the guidance in the report.

      While I have not valued Linkedin explicitly on this blog for the last few years, it has been a company that has impressed me for a simple reason. Unlike many other social media companies that seemed to be focused on just collecting users, Linkedin has always seemed more aware of the need to work on two channels, delivering more users to keep markets happy and working, at the same time, on monetizing these users in the other, for the eventuality that markets will start wanting more at some point in time. Its presence in the manpower market also means that it does not have to become one more player in the crowded online advertising market, where the two biggest players (Facebook and Google) are threatening to run up their scores. Nothing in the latest earnings report would lead me to reassess this story, with the only caveat being that the drop in earnings in the most recent year suggests that profit margins in the manpower business are likely to be smaller and more volatile than in the advertising business.

      Allowing for Linkedin’s presence in two markets, I revalued the company with revenue growth of 25% a year for the next five years, leading to $15.3 billion in revenues in steady state (ten years from now), and a target pre-tax operating margin of 18%, lower than my target margins for Twitter or Facebook, reflecting the lower margins in the manpower business. The value per share that I get for the company is $103.49, about 10% below where the market is pricing the stock right now. The results of the simulation are presented below:

      Spreadsheet with valuation
      At its current stock price, there is about a 40% chance that the company is under valued.  If you have wanted to hold LinkedIn stock, and have been put off by the pricing, the price is tantalizingly close to making it happen. As with other social media companies, LinkedIn’s user base of 410 million and their activity on the platform are the drivers of its revenues and value.

      The Acquisition Option
      If you are already invested in GoPro or LinkedIn, one reason that you may have is that there will be someone out there, with deep pockets, who will acquire the firm, if the price stays where it is or drops further, thus putting a floor on the value. That is not an unreasonable assumption but to me, this has always been fool's gold, where the hope of an acquisition sustains value and the price goes up and down with each rumor. I have seen it play out on my Twitter investment and I do think it gets in the way of thinking seriously about whether your investment is backed by value.

      That said, I do think that having an asset or assets that could be more valuable to another company or entity does increase the value of a company. It is akin to a floor, but it is a shifting floor, and here is why. Consider LinkedIn, a company with 410 million users. Even with the drop in market prices of social media companies in the last few months, the market is paying roughly $80/user (down from about $100/user a couple of years ago). You could argue that an acquirer would be a bargain, if they could acquire LinkedIn at $8 billion, roughly $20 a user. However, the price that an acquirer will be willing to pay for LinkedIn users will increase if revenues are growing at a healthy rate and the company is monetizing its users. 

      To evaluate the impact that introducing the possibility of an acquisition does to LinkedIn's value, I started by assuming that the acquisition price for LinkedIn would be $8 billion, but that the value would range from $4 billion (if revenue growth is flat and margins are low) to $12 billion (if revenue growth is robust). I then reran the simulation of LinkedIn's valuation, with the assumption that the company would be bought out, if the market capitalization dropped below the acquisition price. In the picture below, I compare the values across the two simulations, one without an acquisition floor and one with:

      You may be surprised by how small the effect of introducing an acquisition floor has on value but it reflects two realities. One is my assumption that the expected acquisition price is $8 billion; raising that number towards the current market capitalization of $15.4 billion will increase the effect. The other is my assumption that the acquisition price will slide lower, if LinkedIn's revenue growth and operating profitability lag. 

      Fighting my Preconceptions
      I must start with a confession. After watching the price drop on these two stocks, and prior to my valuations, I really, really wanted LinkedIn to be my investment choice. I like the company for many reasons:

      1. As noted earlier, unlike many other social media companies, it is not just an online advertising company.
      2. The other business (networking and manpower) that the company operates in is appealing both because of its size, and the nature of the competition.
      3. The top management of LinkedIn has struck me as more competent and less publicity-conscious that those at some other high profile social media companies. I think it is good news that I had to think a few minutes about who LinkedIn's CEO was (Jeff Weiner) and check my answer.

      I have a sneaking suspicion that my biases did affect my inputs for both companies, making me more pessimistic in my GoPro inputs and more optimistic on my LinkedIn values. That said, the values that I obtained were not in keeping with my preconceptions. In spite of my inputs, GoPro is significantly under valued and in spite of my implicit attempts to pump it up, LinkedIn does not make my value cut. Put differently, the market reaction to the most recent earnings report at LinkedIn was clearly an over reaction, but it just moved the stock from extremely over valued, on my scale, to close to fair value. 

      YouTube Video

      Datasets
      1. GoPro - Bloomberg Summary (including 2015 numbers)
      2. LinkedIn - Bloomberg Summary (including 2015 numbers)
      Spreadsheets
      1. GoPro - Valuation in February 2016
      2. Twitter - Valuation in February 2016
      Blog posts in this series
      1. A Violent Earnings Season: The Pricing and Value Games
      2. Race to the top: The Duel between Alphabet and Apple!
      3. The Disruptive Duo: Amazon and Netflix 
      4. Management Matters: Facebook and Twitter
      5. Lazarus Rising or Icarus Falling? The GoPro and LinkedIn Question!
      6. Investor or Trader? Finding your place in the Value/Price Game! (Later this year)
      7. The Perfect Investor Base? Corporation and the Value/Price Game (Later this year)
      8. Taming the Market? Rules, Regulations and Restrictions (Later this year)

      Negative Interest Rates: Impossible, Unnatural or Just Unusual?

      $
      0
      0

      In the years since the 2008 crisis, there is no question in finance that has caused more angst among investors, analysts and even onlookers than what to do about "abnormally low" interest rates. In 2009 and 2010, the response was that rates would revert back quickly to normal levels, once the crisis had passed. In 2011 and 2012, the conviction was that it was central banking policy that was keeping rates low, and that once banks stopped or slowed down quantitative easing, rates would rise quickly. In 2013 and 2014, it was easy to blame one crisis or the other (Greece, Ukraine) for depressed rates. In 2015, there was talk of commodity price driven deflation and China being responsible for rates being low. With each passing year, though, the conviction that rates will rise back to what people perceive as normal recedes and the floor below which analysts thought rates would never go has become lower. Last year, we saw short term interest rates in at least two currencies (Danish Krone, Swiss Franc) become negative and this year, the Japanese Yen joined the group, with rumors that the Euro may be the next currency to breach zero. While it has been difficult to explain the low interest rates of the last few years, it becomes doubly so, when they turn negative. I would be lying if I said that negative interest rates don't make me uncomfortable, but I have had to learn to not only make sense of them but also to live with them, in valuation and corporate finance. This post is a step in that direction.

      Setting the table
      There are a handful of currencies that have made the negative interest rate newswire, but it is worth noting that the rates that are being referenced in many of these stories are rates controlled by central banks, usually overnight rates for banks borrowing from the central bank. In March 2016, there were two central banks that had set their controlled rates below zero (Switzerland and Sweden) and two more (ECB and Bank of Japan) that had set the rate at zero. (Update: The ECB announced that it would lower its rates below zero on March 10.)
      February 2016
      Note that these are central bank set rates and that short and long term market interest rates in these currencies can take their own path. To provide a contrast, consider the Japanese Yen and Euro, two currencies where the central banks have pushed the rates they control to zero. In both currencies, short term market interest rates have in fact turned negative but only the Yen has negative long term interest rates:

      In a post from earlier this year, I looked at long term (ten-year) risk free rates in different currencies, starting with government bond rates in each currency and then netting out sovereign default spreads for governments with default risk. Updating that picture, the government bond rates across currencies on March 9, 2016, are shown below:
      Ten-year Government Bond Rates - March 9, 2016
      Joining the Japanese Yen is the Swiss Franc in the negative long term interest rate column. Why make this distinction between central bank set rates, short term market interest rates and long term interest rates? It is easier to explain away negative central bank set rates than it is to explain negative short term interest rates and far simpler to provide a rationale for negative rates in the short term than negative rates in the long term. Thus, there have been episodes, usually during crises, where short term interest rates have turned negative, but this is the first instance that I can remember where we have faced negative long term rates on two currencies, the Swiss Franc and the Japanese yen, with the very real possibility that they will be joined by the Euro, the Danish Krone, the Swedish Krona and even the Czech Koruna in the near future.

      Interest Rates 101
      I am not a macroeconomist, have very little training in monetary economics and I don't spent much time examining central banking policies. Keep that in mind as you read my perspective on interest rates, and if you are an expert and find my views to be juvenile, I am sorry. That said, I have to process negative interest rates, using my limited knowledge  of what determines interest rates.

      Intrinsic and Market-set Interest Rates
      When I lend money to another individual (or buy bonds issued by an entity), there are three components that go into the interest rate that I should demand  on that bond. The first is my preference for current consumption over future consumption, with rates rising as I value current consumption more. The second is expected inflation in the currency that I am lending out, with higher inflation resulting in higher rates. The third is an added premium for any uncertainty that I feel about not getting paid, coming from the default risk that I see in the borrower. When the borrower is a default-free entity, there are only two components that go into a nominal interest rate: a real interest rate capturing the current versus future consumption trade off and an expected inflation rate.
      Nominal Interest Rate = Real Interest Rate + Expected Inflation Rate
      This is, of course, the vaunted Fisher equation.  There is an alternate view of interest rates, where the interest rate on long term bonds is determined by the demand and supply of bonds, and it is shifts in the demand and supply that drive interest rates:

      How do you reconcile these two worlds? To the extent that those demanding bonds are motivated by the need to earn interest that covers the expected inflation and generate a real interest rate, you could argue that in the long term, the intrinsic rate should converge on the market set rate.

      In the short term, though, as with any financial asset, there is a real chance that the market-set rate can be lower or higher than the intrinsic rate. What can cause this divergence? It could be investor irrationality, where bond buyers overlook their need to cover inflation and earn a real rate of return. It could be a temporary shock to the supply or demand side of bonds that can cause the market-set rate to deviate; this is perhaps the best way to think about the "flight to safety" that occurs during every crisis, resulting in lower market interest rates. There is one more reason and one that many investors seem to view as the dominant one and I will address it next.

      The Central Bank and Interest Rates
      In all of this discussion, notice that I have studiously avoided bringing the central bank into the process, which may surprise you, given the conventional wisdom that central banks set interest rates. That said, a central bank can affect interest rates in one of two ways:

      • The first and more conventional path is for the central bank to signal, through its actions on the rates that it controls what it thinks about inflation and real growth in the future, and with that signal, it may alter long term rates. Thus, the Fed lowering the Fed funds rate (a central bank set rate that banks can borrow from the Fed Window) will be viewed as a signal that the Fed sees the economy as weaken and expects inflation to stay subdued or even non-existent, and this signal will then push expected inflation and real interest rates down. This will work only if central banks are credible in their actions, i.e., they are viewed as acting in good faith and with good information and are not gaming the market. 
      • The second channel is for the central bank to actively enter the bond market and buy or sell bonds, thus affecting the demand for bonds, and interest rates. This is unusual but it is what central banks in the United States and the EU have done since 2008 under the rubric of quantitive easing. For this to have a material effect on interest rates, the central bank has to be a big enough buyer of bonds to make a difference. 
      Thus, as you read the news stories about the Japanese central bank and the ECB considering negative interest rates, recognize that they cannot impose these rates by edict and that all they can do is change the rates that they control and let the signaling impact carry the message into bond markets.

      Measuring the Fed Effect
      Just ahead of the Federal Open Market Committee meetings last year, as debate about whether the Fed would ease up on quantitative easing, I argued that we were over estimating the effect that the Fed had on market set rates and that while it has contributed to keeping rates low for the last six years, an anemic economy was the real reason for low interest rates. To compute the Fed effect, I chose to track two numbers:
      • An intrinsic interest rate, computed by adding together the actual inflation each year and the real growth rate each year, two imperfect proxies for expected inflation and the real interest rate.
      • The ten-year US treasury bond rate at the start of each year, set by the bond market, but affected by expectation setting and bond buying by the Fed.
      The graph below captures both numbers, updated through 2015:

      Note how closely the US treasury bond has tracked my imperfect estimate of the intrinsic interest rate, and how low the intrinsic rate has become, post-crisis. At the risk of repeating myself, the Fed has, at best, had only a marginal impact on interest rates during the last six years and it is my guess that rates would have stayed low with or without the Fed during this period.

      Negative Interest Rates
      Turning to the question at hand, is it possible for nominal interest rates to be negative, based upon fundamentals? The answer is yes, but with a caveat. If the preference for current consumption over future consumption dissipates or gets close to zero and you expect deflation in a currency, you could end up with a negative interest rate. In fact, that is the common thread that runs through the economies (Japan, the Euro Zone, Switzerland) where rates have become negative.

      Now, comes the caveat. If you have nominal negative interest rates, why would you ever lend money out, since you have the option of just holding on to the money as cash. Historically, that has led many to believe that the floor on nominal rates should be zero. As rates go below zero, it is time to reexamine that belief. One way to reconcile negative interest rates with rational behavior is to introduce costs to holding cash and there are clearly some to factor in, especially in today's economies. The first is that while the proverbial stuffing cash under your mattress option is thrown around as a choice, you will increase your exposure to theft and may have to invest in security measures that are costly. The second is that there are some transactions that are extraordinarily cumbersome to get done with cash; imagine buying a million dollar house and counting out the cash for the payment. The Danish, Swiss and Japanese governments are embarking on a grand experiment, perhaps, of how much savers will be willing to pay for the convenience of staying cashless. In effect, the lower bound has shifted below zero but there is still one. To those who are convinced that negative interest rates have nothing to do with fundamentals and that they are entirely by central bank design, I would argue that the only reason that these central banks have been able to push rates below zero, is because real growth and inflation have become so low in their economies that the intrinsic rate was close enough to zero to begin with. There is no chance that the Brazilian and Indian central banks will follow suit.

      Interest Rates, Financial Assets and the Real Economy
      When central banks in these currencies strongly signal their intent to drive interest rates to zero and below, what could be the motivation? Put simply, it is the belief that lower interest rates lead to higher prices for financial assets and more real investment in the economy, either through the mechanism of "lower" hurdle rates for investments or a weaker currency making businesses more competitive globally. In this central banking heaven, where central banks set rates and the world meekly follows, this is what unfolds:

      So, why has it not worked? As interest rates in the US, Europe and Japan have tested new lows each year for the last few, we have not seen an explosion in real investment in these countries, and while stock prices have risen, the rise has had as much to do with higher earnings and cash flows, as it has to do with lower interest rates. In my view, the fundamental miscalculation that central banks have made is in assuming that their actions not only affect other pieces of this puzzle but are also read as signals of the future.  In particular, central bankers have failed to incorporate three problems: that interest rates do not always follow the central bank lead, that risk premiums on equity and debt may increase as rates go down and that exchange rate effects are muted by other central banks acting at the same time. In this reality-based central banking universe, the lowering of rates by central banks can have unpredictable and often perverse consequences, lowering financial asset prices, reducing real investment and making a currency stronger rather than weaker.

      This is all hypothetical, you may say, but there is evidence that markets have become much less trusting of central banking and more willing to go their own ways. For instance, as the risk free rate has dropped over the last few years, note that the expected return for stocks has stayed around 8% during that period, leading to higher and higher equity risk premiums.

      While bond markets initially did not see this phenomenon, last year default spreads on bonds in every ratings class widened, even as rates dropped. Interestingly, the most recent ECB announcement that they would push the rates they control lower was accompanied by news that they would enter the bond market as buyers, hoping to keep default spreads down. That is an interesting experiment and I have a feeling that it will not end well.

      Dealing with Negative Interest Rates
      My interests in negative interest rates are primarily in the context of valuation and corporate finance. In both arenas, the hurdle rates we use to pick investments and value businesses build off a long term risk free rate as a base and having that base become a negative value is disconcerting to some. There are two choices that you have:
      1. Switch currencies: You can value Danish companies in Euros or US dollars, where long term rates are still positive (albeit very low). This evades the problem, but you can run but you cannot hide. At some point in time, you will have to work in the negative interest rate currency.
      2. Normalize risk free rates: This is a practice that has become more prevalent in both the US and Europe, where risk free rates have dropped to historic lows. To compensate, analysts are using the average rate across long periods as a normalized risk free rate. I have problems with this approach at three levels. The first is that normal is in the eye of the beholder and what you call a normal 10-year T.Bond rate is more a function of your age than scientific judgment. The second is that given that the risk free rate is where you plan to put your money if you don't make your real investment, it seems singularly dangerous for this to be a made-up number. The third is that using a normalized risk free rate with the high equity risk premiums that are prevalent today will lead to too high a hurdle rate, since the latter are primarily the result of low risk free rates.
      3. Leave the risk free rate negative: So, what if the risk free rate is negative? In valuation, you almost never use the risk free rate standing alone, but only in conjunction with a risk premium. If you can update those risk premiums, they may very well offset the effect of having a negative risk free rate and yield a cost of equity and/or debt that does not look different from what it did prior to the negative interest rate setting. There is one other adjustment that I would make. In stable growth, I have been a proponent of using the risk free rate as your cap on the stable growth rate. With negative risk free rates, I would stick with this principle, since, as I noted earlier in this post, negative interest rates signify economies with low or no real growth combined with deflation and the growth rate in perpetuity for stable companies in these economies should be negative for those same reasons.
      What Real Negative Interest Rates Signify
      When interest rates of from being really small positive numbers (0.25% or 0.50%) to really small negative numbers (-0.25% to -0.50%), the mathematical consequences are small but I do think that breaching zero has consequences and almost all of them are negative.
      1. The economic end game: For those who ultimately care about real economic growth and prosperity, negative interest rates are bad news, since they are incompatible with a healthy, growing economy. 
      2. Central banks insanity, impotent and desperate: As I watch central bankers preen for the cameras and hog the limelight, I am reminded of the old definition of insanity as trying the same thing over and over, expecting a different outcome. After six years of continually trying to lower rates, with the expectation of economic growth just around the corner, it is time for central banks to perhaps recognize that this lever is not working. By the same token, the very fact that central banks revert back to the interest rate lever, when the evidence suggests that it has not worked, is a sign of desperation, an admission by central banks that they have run out of ideas. That is truly scary and perhaps explains the rise in risk premiums in financial markets and the unwillingness of companies to make real investments. 
      3. Unintended consequences: As interest rates hit zero and go lower, there will be some investors, in need of fixed income, who will look in dangerous places for that income. A modern-day Bernie Madoff would need to offer only 4% in this market to attract investors to his fund and as I watch investors chase after yieldcos, MLPs and other high dividend paying entities, I am inclined to believe that is a painful reckoning ahead of us. 
      4. An opening for digital currencies: In a post a few years ago, I looked at bitcoin and argued that there will be a digital currency, sooner rather than later, that meets the requirements of trust needed for a currency in wide use. The more central bankers in conventional currencies play games with interest rates, the greater is the opening for a well-designed digital currency with a dependable issuing authority to back it up.
      In the next few weeks, I am sure that we will read more news stories about central banks professing to be shocked that markets have not done their bidding and that economies have not revived. I am not sure whether I should attribute these rantings to the hubris of central bankers or to their blindness to market realities. Either way, I feel less comfortable with the notion that central bankers know what they are doing and that we should trust them with our economic fates.

      YouTube Video

      Datasets


      Valeant: Information Vacuums, Management Credibility and Investment Value

      $
      0
      0

      As an investor, would you buy shares in a company that is at the center of a political and legal firestorm? What if this company has a CEO who has lost the faith of his board and an ex-CFO who is being accused of shady financial practices? And would you pull  the buy trigger if the company has delayed its scheduled annual filing by more than two months, and by doing so is running the risk of violating debt covenants and being pushed into default? And to top it all off, would you be a little worried  if the largest investor in the stock, a well known activist with his reputation and wealth on the line, is now calling the shots? No way, you say! At the right price, I would, and that is the reason that I decided to revisit my Valeant valuation last week, six months after I valued it for the first time, in the aftermath of a crisis born of hubris and happenstance. In structuring this post, I will draw on an old-time consulting matrix, where companies were classified into stars, cash cows, dogs and question marks, to illustrate the transience of these classifications, since Valeant has cycled through the entire matrix in a year.

      Valeant, the Star
      Valeant's rise from an obscure Canadian drug company to pharmaceutical star has been well chronicled and rather than drown you in prose, I think it is best captured in this picture, which shows the increase in market value (market cap and enterprise value) and operating numbers (revenues and operating income), especially between 2009 and 2015:
      Source: S&P Capital IQ
      During a period when other pharmaceutical companies were struggling with revenue growth and profit margins, Valeant outstripped them on both counts, growing revenues at almost 43% a year while posting higher operating profit margins than the rest of the sector. At least on the surface, the company seemed to be delivering the best of all combinations: high growth with high profitability.

      So, how did Valeant pull of this feat? In an earlier post on the company, in November 2015, I argued that the Valeant business model was a stool with three legs: growth from acquisitions, with the acquisitions funded primarily with debt, followed by a strategy of increasing prices on "under priced" drugs.

      The unique combination of growth and profitability made the company a target for value investors, making it a favored stop for investors as diverse as Bill Ackman, the activist investor, and the Sequoia Fund, a storied mutual fund, and a dominant part of their portfolios. In their defense, not only were these investors transparent about their big bets on Valeant, but at least until September 2015, their concentration was viewed as a strength rather than a weakness. In fact, when I posted on why diversification is a necessary component of even a value investing strategy, it was these two investors that were held up as a counters to my argument.

      To see the allure of Valeant to value investors, let me go back to mid-year last year, when the company's business model was going strong, its stock price was higher than $200/share and its enterprise value exceeded $100 billion. If the intrinsic value of a company is driven by cash flows from existing assets, value-creating growth and low risk, Valeant looked attractive on almost every dimension:

      Valeant was not only delivering the value trifecta, high revenue growth in conjunction with high operating profit margins and generous excess returns, but was doing so on steroids (taking the form of low taxes and high debt). One note of caution even then, though, was that the business model was built on an architecture of acquisitions, with acquisition accounting playing a large role in pushing up operating profitability and lowering taxes.  If you were unfazed by the acquisition accounting effect and assumed that the company could continue to deliver this combination going forward, the value per share that you would have been obtained for the company would have been more than $200/share. 
      Download spreadsheet
      In estimating the value, I did lower the compounded revenue growth for Valeant to 12% for the next ten years, but that translates into revenues more than tripling over the decade. 

      From Star to Cash Cow
      While many trace Valeant's fall to September and October of 2015, when short sellers launched an assault on its links to Philidor, an online pharmacy, the business model was already under pressure in the months prior, a victim of its own financial success. The model was designed, in my view, to operate under the radar, since key parts of it (the drug pricing and acquisition accounting) would wither under exposure. While much of what Valeant did in 2010 and 2011, when the company was not a household name, went unnoticed, its actions in 2015, when it was a higher profile company, drew attention from unwelcome sources. The company's acquisition of Salix increased the scrutiny, both because of it's size and partly because the Salix drugs that Valeant acquired (and repriced) affected more people (and drew more complaints). The Philidor revelations pushed these concerns into hyperdrive and the stock lost almost 55% of its value in September and October, dropping from $180/share to $80/share.

      In my November post, I rehashed much of this story and argued that even if Valeant were able to survive legal and regulatory scrutiny, the company would never be able to return to its old business model. In effect, even in the absence of more bad news, Valeant would have to be run like other pharmaceutical companies, reliant on R&D, rather than acquisitions, for (more anemic) growth. Removing the debt-funded acquisitions and the drug repricing  from the business model yielded a company with lower revenue growth (3% a year, rather than 12%), lower margins (a pre-tax operating margin of 43.66%, instead of 49.82%) and higher taxes (with an effective tax rate of 20% replacing 16.51%).

      Download spreadsheet

      Note that these numbers were reflective of more conventional drug companies and reflect a profitable, albeit slow-growth business. With these numbers, though, the value per share that I obtained for Valeant was about $77, down substantially from its star status, but the market price, at $82, was higher. 

      From Cash Cow to Dog?
      If there were dark clouds on the horizon for Valeant in November 2015, the months since have only made them darker for four reasons:
      1. Information blackout: In November 2015, when I valued Valeant, I used the most recent financial filings of the company, from October 2015,  to update my numbers. Almost six months later, there have been no financial filings since, and the 10K that was expected to be filing in February 2016 was delayed, ostensibly because the company was still gathering information, and that delay has extended into April. 
      2. Managerial Double talk: In the intervening months, Valeant’s managers have been in the news, almost as often giving testimony to Congress, as holding press conferences. Arguing, as they did, that they grew through R&D like any other pharmaceutical company and that their revenue increases came mostly from volume growth (rather than price increases) was so much at odds with the facts that they became less credible with each iteration. Michael Pearson’s hospitalization for an undisclosed illness, just before Christmas, was something that was out of the company’s control but its handling added to the air of opacity around the company. 
      3. Legal Jeopardy: The Philidor entanglement, the original source of the crisis, did not go away. In fact, the company, after claiming that separation from Philidor would be low-cost and easy backtracked in January and February with disclosures that suggested deeper links, with the potential for legal problems down the road. 
      4. Debt load: Debt is a double edged sword, increasing earnings per share and providing tax benefits in good times but potentially making bad times worse. That argument got backing from what happened at Valeant, a company that accumulated more than $30 billion in debt during its acquisition binges, with about half of that debt being added on during 2015. That debt came with the added covenant that if financial disclosures were not filed by March 30, 2015, the firm could technically be in default, a possibility that spooked markets. 
      Without financial disclosures from the company, a management that seemed to be making up stuff as it went along and the possibility of a debt covenant being triggered, it is not surprising that the market marked down Valeant’s stock price further:


      This price collapse, following last year’s swoon, has reduced the market capitalization of the company to $11 billion, almost 85% lower than its value a year prior. In late March 2016, the company announced that Michael Pearson would be stepping down as CEO, the clearest sign yet that there will no return to the old business model, and Bill Ackman increased his involvement of the company in a bid to preserve what was left of his investment in the company and more importantly, his reputation as a savvy activist investor.

      With the stock trading at $32, the question of whether the stock is a good buy now looms large. Compared to my November 2015 estimate, the answer is an emphatic yes, but the caveat is that a great deal has happened to the company’s fundamentals during the last six months that could have shifted the value down significantly. The problem that I face, like any other investor in Valeant, is that in the absence of financial filings, there are no numbers to update. The solution seems simple. Wait for the delayed filing to come out in late April, early May or later, and use that updated information in my valuation. That is the low-risk option, but I think that it is also a low return option, since if the filing contains good news (that revenues have held up and profit margins remain healthy), the stock price will adjust before my valuation does. The alternative is scary, but it has a bigger payoff. I could try to make a judgment on Valeant’s value now, before the information comes out, and follow through by buying or selling the stock. In arriving at this value, here are some of the adjustments that I chose to make:
      1. The Dark Side of Debt: The debt at Valeant has become more burden than a help, as it has not only triggered worries about covenants being violated but has opened up the possibility that that the company will have trouble making its payments. In fact, Moody's lowered the bond rating for Valeant to B1, well below investment grade, in March 2016, causing an increase in the cost of capital used in the valuation from 7.52% (in my November 2016 valuation) to 8.29%. The secondary impact is that there is a chance now that Valeant's going concern status may be jeopardized by its debt commitments; I assume a 5% chance of this occurrence in conjunction with the assumption that a forced liquidation of its assets will come at a discount of 25% on fair value. 
      2. The Bad News in Delay: Delayed news is almost never good news and there are two key operating numbers where the delayed report can contain bad news. The first is that the company may restate revenues, reflecting its separation from Philidor and perhaps for other undisclosed reasons. The second is that the company may reveal that some or all its acquisition-related expensing from prior years may have been overdone, resulting in some or a big chunk of these expenses being moved back into the operating expense column. In my valuation, I will assume (and cheerfully admit that this is based on no news) that the revenue reduction will be small (about 2%) and that half of all acquisition expenses will be shifted to operating expenses, reducing the pre-tax operating margin to 40.39% (from the 43.66% that I used in November 2015). 
      Since I had already assumed that the existing business model was dead in my November 2015 valuation, I don't see any need to lower revenue growth further or to raise the effective tax rate. The value that I obtain with these updated numbers is below:
      Download spreadsheet
      The value per share that I obtain for Valeant is $43.66, higher than the stock price ($32) at the time of this analysis. That value, though, is clearly a bet on what the delayed financials will deliver as a surprise. One way to measure the exposure that you have to this risk is to measure value as a function of how much of a revenue and earnings surprise you get from the report:

      Is there a chance that the earnings report could contain news that make Valeant a bad investment at $32? Of course, and you will have to make your own judgment on that possibility, but based upon my priors (uninformed though they might be), it looked like a good investment at $32, late last week, and I own it now. 

      Conclusion
      I am sure that Valeant will be used to draw many lessons and I will extract my share in future posts about acquisition accounting, activist investing and corporate finance. The first is that acquisition accounting is rife with inconsistencies and plays into investor biases and preconceptions about companies. The second is that cookbook corporate finance, with its dependence on metrics and magic bullets, can have disastrous consequences when it overwhelms the narrative. The third is that activist investing, notwithstanding its successes, has two weak links: concentrated portfolios and investors who can become too wedded to their investment thesis.   I will continue to draw on Valeant as an illustrative example of how quickly views on a company and its business model can change in markets and why absolutism in investing (where you know with certainty that a business model is great or awful, that a stock is cheap or expensive) is an invitation for a market takedown. 

      YouTube Video


      Attachments
      1. Value of Valeant as Star (September 2015)
      2. Value of Valeant as Cash Cow (November 2015)
      3. Value of Valeant as Dog
       

      DCF Myth 3: You cannot do a valuation, when there is too much uncertainty!

      $
      0
      0

      Uncertainty, both imminent and resolved, has been on my mind these last two weeks. I posted my valuation of Valeant on April 20, making the argument that, at least based on my expectations on what could be revealed in the delayed financial filings, the stock was worth about $44, approximately $12 more than the prevailing stock price. Many of you were kind enough to comment on my valuation, and one of the more common refrains was there were too many unknowns on the stock to be taking a stand. In fact, one of the comments on the post was that "regardless of the valuation, a sufficient margin of safety does not exist (on the stock)". On April 21, we got news that Volkswagen had come to an agreement with US authorities on the compensation that they would offer buyers of their cars and a day later, the company announced that it would take an $18.2 billion charge to cover the costs of its emissions misrepresentations. It was a chance for me to revisit my valuation of Volkswagen, in the immediate aftermath of the scandal in October 2015, and take stock of how the the investment I made in the stock then looks, as the uncertainty gets slowly resolved. All through these last two weeks, there were signs that Yahoo's journey, that was starting to resemble the Bataan Death March lately, was nearing its end, as the company reviewed bids for its operating assets. Since it is a stock that I valued almost two years ago (and brought after the valuation) and labeled as a Walking Dead company, I am interested, both financially and intellectually, to see how this end game plays out. As I wrestle with the resolution of uncertainties from the past and struggle with uncertainties in the future on every one of my investments, I thought it would be a good time to look at good and bad ways of responding to I uncertainty in investing and valuation.

      The Uncertainty Principle
      Uncertainty has always been part of human existence, though it has transitioned from the physical uncertainty that characterized the caveman era to the economic uncertainty that is more typical of today, at least in developed markets. Each generation, though, seems to think that it lives in the age of the greatest uncertainty. That may be partially a reflection of a broader sense of "specialness" that afflicts each generation, where it is convinced that its music and movies were the very best and that it had to get through the biggest challenges to succeed. The other is a variation of hindsight bias, where we can look at the past and convince ourselves that what actually happened should have been obvious before it occurred. I am surprised at how many traders, investors and portfolio managers, who lived through the 2008 crisis, have convinced themselves that November 2008 was not that bad and that there was never a chance of a catastrophic ending.  That said, uncertainty not only ebbs and flows over time but also changes form, making enduring fixes and lessons tough to find. As investors bemoan the rise of uncertainty in today's markets, there are three reasons why they may feel more under siege now than in prior decades:
      1. Low Interest Rates: In my post on negative interest rates, I pointed to the fact that as interest rates in many of the leading currencies have dropped to historic lows, risk premiums have increased in both stock and bond markets. The expected return on the S&P 500 in early 2008, before the crisis, was 8% and it remains at about that level today, even though the treasury bond rate has dropped from 4% to less than 2%, but the equity risk premium has risen to compensate. Even though the expected return may be the same, the fact that more of it can be attributed to a risk premium will increase the market reaction to news, in both directions, adding to price volatility.
      2. Globalization: Globalization has not only changed how companies and investors make choices but has also had two consequences for risk. The first is that there seem to be no localized problems any more, with anyone's problem becoming everyone's problem. Thus, political instability in Brazil and too much local government borrowing to build infrastructure in China play out on a global stage, affecting stock prices in the rest of the world. The second is that the center of global economic power is shifting from the US and Europe to Asia, and as it does, Americans and Europeans are starting to bear more of world's economic risk than they used to.
      3. Media/Online Megaphones: As an early adopted of technology, I am far from being a Luddite but I do think that the speed with which information is transmitted around the world has allowed market risks to go viral. It is not just the talking heads on CNBC, Bloomberg and other financial news channels that are the transmitters of these news but also social media, as Twitter and Facebook become the place where investors go to get breaking investing news.
      I am sure that you can add other items to this list, such as the disruption being wrought by technology on established businesses, but I am not sure that these are either uncommon or unusual. Every decade has its own disruptive factors, wreaking havoc on existing business models and company values.

      The Natural Responses to Uncertainty
      Much of financial theory and a great deal of financial practice was developed in the United States in the second half of the last century and therein lies a problem. The United States was the giant of the global economy for much of this period, with an economy on an upward path. The stability that characterized the US economy during this period was unusual, if you look at long term history of economies and markets, and much as we would like to believe that this is because central bankers and policy makers learned their lessons from the great depression, there is the very real possibility that it was just an uncommonly predictable period. That would also mean that the bedrock of financial practice, built on extrapolating from past data and assuming mean reversion in all things financial, may be shaky, and that we have to reevaluate them for the economies that we operate in today. It is unfair to blame the way we deal with uncertainty entirely on the fact that our practices were honed in the United States. After all, it is well chronicled in both psychological annals and behavior studies that we, as human beings, deal with uncertainty in unhealthy ways, with the following being the most common responses:
      1. Paralysis and Inaction: The most common reaction to uncertainty, in my experience, is inaction. "There is too much uncertainty right now to act" becomes the refrain, with the promise that action will come when more of the facts are know. The consequences are predictable. I have friends who have almost entirely been invested in money market funds for decades now, waiting for that moment of clarity and certainty that never seems to come. I have also talked to investors who seem to view investing when uncertain as a violation of value investing edicts and have found themselves getting pushed into smaller and smaller corners of the market, seeking elusive comfort.
      2. Denial and Delusion: At the other end of the spectrum, the reaction that other investors have to uncertainty is go into denial, adopting one of two practices. The number crunchers fall back on false precision, where they add more detail to their forecasts and more decimals to their numbers, as a defense against uncertainty. The story tellers fall back on story telling, acting as if they have the power to write the endings to every uncertain narrative, when in fact they have little control over either the players or the outcome.
      3. Mental Accounting and Rules of Thumb: The brain may be a wondrous organ but it has its own set of tics that undercut investing, when uncertain. As Richard Thaler has so convincingly shown in his work on mental accounting, investors and analysts like to use rules of thumb, often with no basis in fact or reality, when making judgments. Thus, a venture capitalist who is quick to dismiss the use of intrinsic value in a young start-up as too fraught with estimation error, seems to have no qualms about forecasting earnings five years out for the same company and applying a price earnings ratio to those earnings to get an exit value.
      4. Outsourcing and Passing the Buck: When stumped for answers, we almost invariably turn to others that we view as more knowledgeable or better equipped than we are to come up with solutions. Cynically, you could argue that this allows us to avoid taking responsibility for investment mistakes, which we can now attribute to consultants, text book writers or that person you heard on CNBC. 
      5. Prayer and Divine Intervention: The oldest response to uncertainty is prayer and it has had remarkable staying power. There are large segments of the world where big investment and business decisions are preceded by prayers and divine intervention on your behalf. 
      If the first step in change is acceptance, I have come to accept that I am prone to do some or all of the above, when faced with uncertainty, but I have also discovered that these reactions can do damage to my portfolio. 
          Dealing with Uncertainty
          To reduce, if not eliminate, my unhealthy responses to uncertainty, I have developed my own coping mechanisms that will hopefully push me on to healthier tracks. I am not suggesting that these will work for you, but they have for me, and please feel free to modify, abandon or adjust them to your own needs.
          1. Have a narrative: As many of you who read this blog know, I have long believed that a company valuation without a story to bind it together is just numbers on a spreadsheet and a story that uses no numbers at all is a fairy tale. There is another advantage in having a narrative underlie your valuation and tying numbers to that narrative. When faced with uncertainty about specifics, the question that I ask is whether these specifics affect my narrative for the company and if yes, in what way. In my valuation of Volkswagen, right after the diesel emissions scandal, I did not find a catastrophic drop in value for the company because my underlying narrative for Volkswagen, that of a mature business with little to offer in terms of expansion or growth opportunities, was dented but largely unchanged as a result of the scandal. With Valeant, in my November 2015 valuation, I argued that the attention brought to the company by its drug pricing policies and connections to Philidor would result in it having to abandon its strategy of growth driven by acquisitions and growth and to shift to being a less exciting, lower growth pharmaceutical company. That shift in narrative drove the inputs into my valuation and my lower assessment of value. 
          2. Categorize uncertainty: Uncertainty can come from many sources and it is useful, when valuing a company in the face of multiple uncertainties, to classify them. Here are my groupings:


          Since it is easy to miss some uncertainties and double count others, I find it useful to keep them isolated in different parts of my valuation:


          Specifically, in my Volkswagen and Valeant valuations, it was micro risk that concerned me, with some of that risk being continuous (the effect of the diesel emissions scandal on Volkswagen car sales) and some being discrete (the fines levied by the EPA on Volkswagen and the risk of default in Valeant). That is why both companies, at least in my conventional valuations, have low costs of capital, notwithstanding the risky environment, but their values are then adjusted for the expected costs of the discrete events occurring.
          3. Keep it simple:  This may seem ironic but the more uncertainty there is, the simpler my valuation models become, with fewer inputs and less levers to move. One reason is that it allows me to focus on the variables that really drive value for the company and the other is that it reduces my need to estimate dozens of variables in the face of uncertainty. Thus, in my valuations of start-up companies, my focus is almost entirely on three variables: revenue growth, operating margins and the reinvestment needed to sustain that growth. 
          4. Make your best estimates: As I start making my estimates in the face of uncertainty, I hear the voice in the back of my mind pipe up, saying "You are going to be so wrong!" and I silence it by  reminding myself that I don't have to be right, just less wrong than everyone else, and that when uncertainty is rampant, most investors give up.
          5. Face up to uncertainty: Rather than cringe in the face of uncertainty and act like it is not there, I have found that it is freeing to admit that you are uncertain and then to take the next step and be explicit about that uncertainty. In my valuations of tech titans in February 2016, I used probability distributions for the inputs that I felt most shaky about and then reported the values as distributions. Since some of you have been curious about the mechanics of this process, I will take a lengthier journey through the process of running simulations in a companion piece to this post.
          6. Be willing to be wrong: If you don't like to be wrong, it is best not  to value companies in the face of uncertainty. However, if you think that Warren Buffet did not face uncertainty in his legendary investment in American Express after the salad oil scandal in 1964 or that John Paulson knew for sure that his bet against the housing bubble would pay off in 2008, you are guilty of revisionist history. There is a corollary to this point and it relates to diversification. As I have argued in my post on diversification, the more uncertain you feel about individual investments, the more you have to spread your bets. It is not an admission of weakness but a recognition of reality.

          If you are a value investor, you will notice that I have not mentioned one of value investors' favorite defenses against uncertainty, which is the margin of safety. Seth Klarman is one of my favorite investment thinkers but I am afraid that the margin of safety, at least as practiced by some in the investing community, has become an empty vessel, an excuse for inaction rather than a guide to action in risky times. I will come back to this measure as well in another post in this series.

          Conclusion
          If you are an active investor, you are constantly looking for an edge, something that you can bring to the table that most other investors cannot or will not, that you can exploit to earn higher returns. As the investing world gets flatter, with information freely accessible and available to almost all investors, and analytical tools that anyone can access, often at low cost, being comfortable with uncertainty may very well be the edge that separates success from failure in investing. There may be some who are born with that comfort level, but I am not one of them. Instead, my learning has come the hard way, by diving into companies when things are most uncertain and by valuing businesses in the midst of market crises, "by going where it is darkest". That journey is not always profitable (see my experiences with Vale as a precautionary note), sometimes makes me uncomfortable (as I have to make forecasts based upon little or bad information), but it is never boring. I am wrong a hefty percent of the time, but so what? It's only money! I am just glad that I am not a brain surgeon!

          YouTube Video

          Uncertainty Posts
          1. DCF Myth 3: You cannot do a valuation, when there is too much uncertainty
          2. The Margin of Safety: Excuse for Inaction or Tool for Action?
          3. Facing up to Uncertainty: Probabilities and Simulations
          DCF Myth Posts
          Introductory Post: DCF Valuations: Academic Exercise, Sales Pitch or Investor Tool
          1. If you have a D(discount rate) and a CF (cash flow), you have a DCF.  
          2. A DCF is an exercise in modeling & number crunching. 
          3. You cannot do a DCF when there is too much uncertainty.
          4. The most critical input in a DCF is the discount rate and if you don’t believe in modern portfolio theory (or beta), you cannot use a DCF.
          5. If most of your value in a DCF comes from the terminal value, there is something wrong with your DCF.
          6. A DCF requires too many assumptions and can be manipulated to yield any value you want.
          7. A DCF cannot value brand name or other intangibles. 
          8. A DCF yields a conservative estimate of value. 
          9. If your DCF value changes significantly over time, there is either something wrong with your valuation.
          10. A DCF is an academic exercise.

          DCF Myth 3.1: The Margin of Safety - Tool for Action or Excuse for Inaction?

          $
          0
          0

          In my last post on dealing with uncertainty, I brought up the margin of safety, the tool that many value investors claim to use to protect themselves against uncertainty. While there are certainly some in the value investing community who have found a good way to incorporate MOS into their investing process, there are many more who seem to have misconceptions about what it does for them as well as the trade off from using it. 


          The Margin of Safety: Definition and Rationale

          While the margin of safety has always been around, in one form or another, in investing, it was Ben Graham who brought the term into value investing in The Intelligent Investor, when he argued that the secret of sound investment is to have a margin of safety, with the margin of safety defined as the difference between the value of an asset and its price. The definitive book on MOS was written by Seth Klarman, a value investing icon. Klarman’s book has acquired a cult following, partly because of its content and partly because it has been out of print now for years; a quick check of Amazon indicates a second-hand copy can be acquired for about $1600. Klarman’s take on margin of safety is similar in spirit to Graham’s measure, with an asset-based focus on value, which is captured in his argument that investors gain the margin of safety by “buying at a significant discount to underlying business value and giving preference to tangible assets over intangibles”.


          There are many reasons offered for maintaining a margin of safety. The first is that the value of an asset is always measured with error and investors, no matter how well versed they are in valuation techniques, have to recognize that they can be wrong in their judgments. The second is that the market price is determined by demand and supply and if it diverges from value, its pathway back is neither quick nor guaranteed. The proponents of margin of safety point to its benefits. By holding back on making investment decisions (buy or sell) until you feel that you have a margin of safety, they argue that you improve your odds of making successful investments. In addition, They also make the point that having a healthy margin of safety will reduce the potential downside on your investments and help protect and preserve your capital. 

          The Margin of Safety: Divergence across Investors
          As a concept, I not only understand the logic of the MOS, but also its allure, and I am sure that many investors adopt some variant of it in active investing, but there are differences in how it is employed:
          1. Valuation Basis: While MOS is often defined it as the difference between value and price, the way in which investors estimate value varies widely. The first approach is intrinsic value, either in its dividend discount model format or a more expansive DCF version. The second approach estimates value from accounting balance sheets, using either unadjusted book value or variants thereof (tangible book value, for instance). The third approach is to use a pricing multiple (PE, EV to EBITDA), in conjunction with peer group pricing, to estimate “a fair price” for the company. While I would contest even calling this number a value, it is still used by many investors as their estimated value.
          2. Magnitude and Variability: Among investors who use MOS in investing, there seems to be no consensus on what constitutes a sufficient margin. Even among investors who are explicit about their MOS, the follow up question becomes whether it should be a constant (say 15% for all investments) or whether it should be greater for some investments (say in risky sectors or growth stocks) than for others (utilities or MLPs).
          The bottom line is that a room full of investors who all claim to use margin of safety can contain a group with vast disagreements on how the MOS is computed, how large it should be and whether it should vary across investments and time.

          Myths about Margin of Safety
          When talking about value, I am often challenged by value investors on how I control for risk and asked why I don’t explicitly build in a MOS. Those are fair questions but I do think that some of the investors who are most enamored with the concept fundamentally misunderstand it. So, at the risk of provoking their wrath, here is my list of MOS misconceptions.

          Myth 1: Having a MOS is costless
          There are some investors who believe that their investment returns will always be improved by using a margin of safety on their investments and that using a larger margin of safety is costless. There are very few actions in investing that don’t create costs and benefits and MOS is not an exception. In fact, the best way to understand the trade off between costs and benefits is to think about type 1 and type 2 errors in statistical analysis. If type 1 errors refer to the fact that you have a false positive, type 2 errors reflect the opposite problem, where you have a false negative. Translating this proposition into investing, let’s categorize type 1 errors as buying an expensive stock, because you mistake it to be under valued, and type 2 errors as not buying a bargain-priced stock, because you perceive it wrongly to be over valued. Increasing your MOS will reduce your type 1 errors but will increase your type 2 errors. 

          Many risk averse value investors would accept this trade off but there is a cost to being too conservative and  if that cost exceeds the benefits of being careful in your investment choice, it will show up as sub-par returns on your portfolio over extended periods. So, will using a MOS yield a positive or negative payoff? I cannot answer that question for you, because each investor has to make his or her own judgment on the question, but there are simple tests that you can run on your own portfolios that will lead you to the truth (though you may not want to see it). If you find yourself consistently holding more of your overall portfolio in cash than your natural risk aversion and liquidity needs would lead you to, and/or you don't generate enough returns on your portfolio to beat what you would have earned investing passively (in index funds, for instance), your investment process, no matter what its pedigree, is generating net costs for you. The problems may be in any of the three steps in the process: your valuations may be badly off, your judgment on market catalysts can be wrong or you may be using too large a MOS.

          Myth 2: If you use a MOS, you can be sloppy in your valuations
          Value investors who spend all of their time coming up with the right MOS and little on valuation are doing themselves a disservice. If your valuations are incomplete, badly done or biased, having a MOS on that value will provide little protection and can only hurt you in the investment process (since you are creating type 2 errors, without the benefit of reducing type 1 errors). Given a choice between an investor with high quality valuations and no/little MOS and one with poorly done valuations and a sophisticated MOS, I would take the former over the latter every single time.

          I am also uncomfortable with investors who start with conservative estimates of value and then apply the MOS to that conservative value. In intrinsic valuation, conservative values will usually mean haircutting cash flows below expectations, using high discount rates and not counting in growth that is uncertain. In asset-based valuation, it can take the form of counting only some of the assets because they are tangible, liquid or both. Remember that you are already double counting risk, when you use MOS, even if your valuation is a fair value (and not a conservative estimate of value), because that value is computed on a risk-adjusted basis. If you are using a conservative value estimate, you may be triple or even quadruple counting the same risk when making investment decisions. If you are using this process, I am amazed that any investment manages to make it through your risk gauntlets to emerge as a good investment, and it does not surprise me that nothing in the market looks cheap to you.

          Myth 3: The MOS should be the same across all investments 
          I have always been puzzled by the notion that one MOS fits all investments. How can a 15% margin of safety be sufficient for both an investment in a regulated utility as well as a money-losing start-up? Perhaps, the defense that would be offered is that the investors who use MOS as their risk breakers would not look at companies like the latter, but I would still expect that even in the value investing spectrum, different investments would evoke different degrees of uncertainty (and different MOS).

          Myth 4: The MOS on your portfolio = MOS on individual investments in the portfolio
          I know that those who use MOS are skeptics when it comes to modern portfolio theory, but modern portfolio theory is built on the law of large numbers, and that law is robust. Put simply, you can aggregate a large number of risky investments to create a relatively safe portfolio, as long as the risks in the individual stocks are not perfectly correlated. In MOS terms, this would mean that an investor with a concentrated portfolio (who invests in three, four or five stocks) would need a much larger MOS on individual investments than one who spreads his or her bets across more investments, sectors and markets.

          Expanding on this point, using a MOS will create biases in your portfolio. Using the MOS to pick investment will then lead you away from investments that are more exposed to firm-specific risks, which loom large on an individual company basis but fade in your portfolio. Thus, biotechnology firms (where the primary risk lies in an FDA approval process) will never make your MOS cut, but food processing firms will, for all the wrong reasons. In the same vein, Valeant and Volkswagen will not make your MOS cut, even though the risk you face on either stock will be lowered if they are parts of larger portfolios. 

          Myth 5: The MOS is an alternative risk measure
          I know that many investors abhor betas, and believe it or not, I understand. In fact, I have long argued that there are replacements available for portfolio theory-based risk measures and that not only is intrinsic value robust enough to work with these alternative risk measures but that the discount rate is not (and should not) be the ultimate driver of value in most companies. That said, there are some in the value investing community who like to use their dislike of betas as a bludgeon against all financial theory and after they have beaten that straw horse to death, they will offer MOS as their alternative risk measure. That suggests a fundamental misunderstanding of MOS. To use MOS, you need an estimate a value and I am not aware of any intrinsic value model that does not require a risk adjustment to get to value. In other words, MOS is not an alternative to any existing risk measure used in valuation but an add-on, a way in which risk averse investors can add a second layer of risk protection.

          There is one possible way in which the MOS may be your primary risk adjustment mechanism and that is if you use a constant discount rate when doing valuation (a cost of capital of 8% for all companies or even a risk free rate) and then apply a MOS to that valuation to capture risk. If that is your approach, you should definitely be using different MOS for different investments (see Myth 3), with a larger MOS being used on riskier investments. I would also be curious about how exactly you make this MOS adjustment for risk, including what risks you bring in and how you make the conversion.

          Margin of Safety – Incorporating into a Strategy
          I would not put myself in the MOS camp but I recognize its use in investing and believe that it can be incorporated into a good investing strategy. To do so, though, you would need to do the following:
          1. Self examination: Even if you believe that MOS is a good way of picking investments, it is not for everyone. Before you adopt it, you have to assess not only your own standing (including how much you have to invest, how risk averse you are) but also your faith (in your valuation prowess and that markets correct their mistakes). Once you have adopted it, you still need the effects it has on your portfolio, including how often you choose not to invest (and hold cash instead) and whether it makes a material difference to the returns you generate on your portfolio.
          2. Sound Value Judgments: As I noted in the last section, a MOS is useful only if it is an addendum to sound valuations. This may be a reflection of my biases but I believe that this requires intrinsic valuation, though I am willing to concede that there are multiple ways of doing it right. Accounting valuations seem to be built on the twin presumptions that book value is an approximation of liquidation value and that accounting fair value actually means what it says, and I have little faith in either. As for passing of pricing as value, it strikes me as inconsistent to use the market to get your pricing number (by using multiples and comparable firms) and then argue that the same market misprices the asset in question.
          3. A Flexible MOS: Tailor the MOS to the investment that you are looking at: There are two reasons for using a MOS in the first place. The first is an acceptance that, no matter how hard you try, your estimate of value can be wrong and the second is that even if the value estimate is right, there is uncertainty about whether the market will correct its mistakes over your time horizon. If you buy into these two reasons, it follows that your MOS should vary across investments, with the following determinants.
          • Valuation Uncertainty: The more uncertain you are about your estimated value for an asset, other things remaining equal, the larger the MOS should be. Thus, you should use a smaller MOS when investing in mature businesses and during stable markets, than when putting your money in young, riskier business or in markets in crises.
          • Portfolio Tailoring: The MOS that you use should also be tailored to your portfolio choices. If you are a concentrated investor, who invests in a four or five companies, you should use a much higher MOS than an investor who has a more diversified portfolio, and if you the latter, perhaps even modify the MOS to be larger for companies that are exposed to macroeconomic risks (interest rates, inflation, commodity prices or economic cycles) than to company-specific risks (regulatory approval, legal jeopardy, management flux).
          • Market Efficiency: I know that these are fighting words to an active investor, red flags that call forth intemperate responses. The truth, though, is that even the most rabid critics of market efficiency ultimately believe in their own versions of market efficiency, since if markets never corrected their mistakes, you would never make money of even your canniest investments. Consequently, you should settle for a smaller MOS when investing in stocks in markets that you perceive to be more liquid and efficient than in assets, where the corrections will presumably happen more quickly than in inefficient, illiquid markets where the wait can be longer.
          • Pricing Catalysts: Since you make money from the price adjusting to value, the presence of catalysts that can lead to this adjustment will allow you to settle for a lower MOS. Thus, if you believe that a stock has been mispriced ahead of an earnings report, a regulatory finding or a legal judgment, you should demand a lower MOS than when you invest in a stock that you believe is misvalued but with no obvious pricing catalyst in sight. 
          Finally, if MOS is good enough to use when you buy a stock, it should be good enough to use when you sell that stock. Thus, if you need a stock to be under valued by at least 15%, to buy it, should you also not wait until it is at least 15% over valued, to sell it? This will require you to abandon another nostrum of value investing, which is that once you buy a great company, you should hold it forever, but that is not just unwise but is inconsistent with true value investing.
            Conclusion
            Would I prefer to buy a stock at a 50% discount on value rather than at just below fair value? Of course, and I would be even happier if you made that a 75% discount. Would I feel even more comfortable if you estimated value very conservatively. Yes and I would be delighted if all you counted was liquid assets. That said, I don't live in a  world where I see too many of these investments and when I do, it is usually the front for a scam rather than a legitimate bargain.  That is the reason that  I have never formally used a MOS in investing. I did buy Valeant at $32, because my valuation of the stock yielded $45 for the company. Would I have still bought the stock, if my value estimate had been only $35 or if it was a big chunk of my portfolio? Perhaps not, but I have bought stocks that were priced at my estimated fair value and have held back on investments that I have found to be under valued by 25% or more. Why? That has to wait for my coming post on simulations, since this one has run its course.

            YouTube Video


            Uncertainty Posts
            1. DCF Myth 3: You cannot do a valuation, when there is too much uncertainty
            2. The Margin of Safety: Excuse for Inaction or Tool for Action?
            3. Facing up to Uncertainty: Probabilities and Simulations
            DCF Myth Posts
            Introductory Post: DCF Valuations: Academic Exercise, Sales Pitch or Investor Tool
            1. If you have a D(discount rate) and a CF (cash flow), you have a DCF.  
            2. A DCF is an exercise in modeling & number crunching. 
            3. You cannot do a DCF when there is too much uncertainty.
            4. The most critical input in a DCF is the discount rate and if you don’t believe in modern portfolio theory (or beta), you cannot use a DCF.
            5. If most of your value in a DCF comes from the terminal value, there is something wrong with your DCF.
            6. A DCF requires too many assumptions and can be manipulated to yield any value you want.
            7. A DCF cannot value brand name or other intangibles. 
            8. A DCF yields a conservative estimate of value. 
            9. If your DCF value changes significantly over time, there is either something wrong with your valuation.
            10. A DCF is an academic exercise.

            DCF Myth 3.2: If you don't look, its not there!

            $
            0
            0

            In this, the last of my three posts on uncertainty, I complete the cycle I started with a look at the responses (healthy and unhealthy) to uncertainty and followed up with an examination of the Margin of Safety, by taking a more extended look at one approach that I have found helpful in dealing with uncertainty, which is to run simulations. Before you read this post, I should warn you that I am not an expert on simulations and that the knowledge I bring to this process is minimalist and my interests are pragmatic. So, if you are an expert in statistics or a master simulator, you may find my ramblings to be amateurish and I apologize in advance. 

            Setting the Stage
            The tools that we use in finance were developed in simpler times, when data was often difficult (or expensive) to access and sophisticated statistical tools required machine power that was beyond the reach of most in the finance community. It should come as no surprise then that in discounted cash flow valuation, we have historically used point estimates ( single numbers that reflect best judgments at the time of the valuation) for variables that have probability distributions attached to them. To illustrate, in my valuation of Apple in February 2016, I used a revenue growth rate of 2.2% and a target operating margin of 25%, to arrive at my estimate of value per share of $129.80.

            It goes without saying (but I will say it anyway) that I will be wrong on both these numbers, at least in hindsight, but there is a more creative way of looking at this estimation concern. Rather than enter a single number for each variable, what if I were able to enter a probability distribution? Thus, my estimate for revenue growth would still have an expected value of 2.2% (since that was my best estimate) but would also include a probability distribution that reflected my uncertainty about that value. That distribution would capture not only the magnitude of my uncertainty (in a variance or a standard deviation) but also which direction I expect to be wrong more often (whether the growth is more likely to be lower than my expected value or higher).  Similarly, the expected value for the operating margin can stay at 25% but I can build in a range that reflects my uncertainty about this number.

            Once you input the variables as distributions, you have laid the foundations for a probabilistic valuation or more specifically, for a simulation, where in each run, you pick one outcome out of each distribution (which can be higher or lower than your expected values) and estimate a value for the company based on the drawn outcomes. Once you have run enough simulations, your output will be a distribution of values across simulations. If the distributions of your variables are built around expected values that match up to the numbers that you used in your point estimate valuation, the expected value across the simulations will be close to your point estimate value. That may seem to make the simulation process pointless, but there are side benefits that you get from simulations that enrich your decision process. In addition to the expected value, you will get a measure of how much variability there is in this value (and thus the risk you face), the likelihood that you could be wrong in your judgment of whether the stock is under and over valued and the potential payoffs to be right and wrong. 

            Statistical Distributions: A Short Preview
            It is a sad truth that most of us who go through statistics classes quickly consign them to the “I am never going to use this stuff” heap and move on, but there is no discipline that is more important in today’s world of big data and decision making under uncertainty. If you are one of those fortunate souls who not only remembers your statistics class fondly but also the probability distributions that you encountered during the class, you can skip this section. If, like me, the only memory you have of your statistics class is of a bell curve and a normal distribution, you need to expand your statistical reach beyond a normal distribution, because much of what happens in the real world (which is what you use probability distributions to capture) is not normally distributed. At the risk of over simplifying the choices, here are some basic classifications of uncertainties/ risks::
            1. Discrete versus Continuous Distributions: Assume that you are valuing an oil company in Venezuela and that you are concerned that the firm may be nationalized, a risk that either occurs or does not, i.e., a discrete risk. In contrast, the oil company's earnings will move with oil prices but take on a continuum of values, making it a continuous risk. With currency risk, the risk of devaluation in a fixed exchange rate currency is discrete risk but the risk in a flaring rate currency is continuous.
            2. Symmetric versus Asymmetric Distributions (Symmetric, Positive skewed, Negative skewed): While we don't tend to think of upside risk, risk can deliver outcomes that are better than expected or worse than expected. If the magnitude and likelihood of positive outcomes and negative outcomes is similar, you have a symmetric distribution. Thus, if the expected operating margin for Apple is 25% and can vary with equal probability from 20% to 30%, it is symmetrically distributed. In contrast, if the expected revenue growth for Apple is 2%, the worse possible outcome is that it could drop to -5%, but there remains a chance (albeit a small one) that revenue growth could jump back to 25% (if Apple introduces a disruptive new product in a big market), you have an a positively skewed distribution. In contrast, if the expected tax rate for a company is 35%, with the maximum value equal to the statutory tax rate of 40% (in the US) but with values as low as 0%, 5% or 10% possible (though not likely), you are looking at a negatively skewed distribution.
            3. Extreme outcome likelihood (Thin versus Fat Tails): There is one final contrast that can be drawn between different risks. With some variables, the values will be clustered around the expected value and extreme outcomes, while possible, don't occur very often; these are thin tail distributions. In contrast, there are other variables, where the expected value is just the center of the distribution and actual outcome that are different from the expected value occur frequently, resulting in fat tail distributions.
            I know that this is a very cursory breakdown, but if you are interested, I do have a short paper on the basics of statistical distributions (link below), written specifically with simulations in mind. 

            Simulation Tools
            I was taught simulation in my statistics class, the old fashioned way. My professor came in with three glass jars filled with little pieces of paper, with numbers written on them, representing the different possible outcomes on each variable in the problem (and I don't even remember what the problem was). He then proceeded to draw one piece of paper (one outcome) out of each jar and worked out the solution, with those numbers and wrote it on the board. I remember him meticulously returning those pieces of paper back into the jar (sampling with replacement) and at the end of the class, he proceeded to compute the distribution of his solutions.

            While the glass jar simulation is still feasible for simulating simple processes with one or two variables that take on only a few outcomes, it is not a comprehensive way of simulating more complex processes or continues distributions. In fact, the biggest impediment to using simulation until recently would have been the cost of running one, requiring the use of a mainframe computer. Those days are now behind us, with the evolution of technology both in the form of hardware (more powerful personal computers) and software. Much as it is subject to abuse, Microsoft Excel has become the lingua franca of valuation, allowing us to work with numbers with ease. There are some who are conversant enough with Excel's bells and whistles to build simulation capabilities into their spreadsheets, but I am afraid that I am not one of those. Coming to my aid, though, are offerings that are add-ons to Excel that allow for the conversion of any Excel spreadsheet almost magically into a simulation.

            I normally don't make plugs for products and services, even if I like them, on my posts, because I am sure that you get inundated with commercial offerings that show up insidiously in Facebook and blog posts. I am going to make an exception and praise Crystal Ball, the Excel add-on that I use for simulations. It is an Oracle product and you can get a trial version by going here. (Just to be clear, I pay for my version of Crystal Ball and have no official connections to Oracle.) I like it simply because it is unobtrusive, adding a menu item to my Excel toolbar, and has an extremely easy learning curve.

            My only critique of it, as a Mac user, is that it is offered only as a PC version and I have to run my Mac in MS Windows, a process that I find painful. I have also heard good things about @Risk, another excel add-on, but have not used it.

            Simulation in Valuation
            There are two aspects of the valuation process that make it particularly well suited to Monte Carlo simulations. The first is that uncertainty is the name of the game in valuation, as I noted in my first post in the series. The second is that valuation inputs are often estimated from data, and that data can be plentiful at least on some variables, making it easier to estimate the probability distributions that lie at the heart of simulations. The sequence is described in the picture below:


            Step 1: Start with a base case valuation
            The first place to start a simulation is with a base case valuation. In a base case valuation, you do a valuation with your best estimates for the inputs into value from revenue growth to margins to risk measures. Much as you will be tempted to use conservative estimates, you should avoid the temptation and make your judgments on expected values. In the case of Apple, the numbers that I use in my base case valuation are very close to those that I used just a couple of months ago, when I valued the company after its previous earnings report and are captured in the picture below:
            Download spreadsheet

            In my base case, at least, it looks like Apple is significantly under valued, priced at $93/share, with my value coming in at $126.47, just a little bit lower my valuation a few months ago. I did lower my revenue growth rate to 1.50%, reflecting the bad news about revenues in the most recent 10Q.

            Step 2: Identify your driver variables
            While there are multiple inputs into valuation models that determine value, it remains true that a few of these inputs drive value and that the rest go along for the ride. But how do you find these value drivers? There are two indicators that you can use. The first requires trial and error, where you change each input variable to see which ones have the greatest effect on value. It is one reason that I like parsimonious models, where you use fewer inputs and aggregate numbers as much as you can. The second is more intuitive, where you focus on the variable that investors in the company seem to be most in disagreement about. My Apple valuation is built around four inputs: revenue growth (growth), operating margin (profitability), the sales to capital ratio (investment efficiency) and cost of capital (risk). The graph below captures how much value changes as a function of these inputs:

            As you can see the sales to capital ratio has little effect on value per share, largely because the base case growth rate that I use for Apple is so low. Revenue growth and operating margin both affect value significantly and cost of capital to a much lesser degree. Note that the value per share is higher than the current price though every single what-if analysis, but that reflects the fact that only variable at a time in being changed in this analysis. It is entirely possible that if both revenue growth and operating margins drop at the same time, the value per share will be lower than $93 (the stock price at the time of this analysis) and one of the advantages of a Monte Carlo simulation is that you can build in interconnections between variables. Looking at the variables through the lens that investors have been using to drive the stock price down, it seems like the front runner for value driver has to be revenue growth, as Apple reported its first year on year negative revenue growth in the last quarter and concerns grow about whether the iPhone franchise is peaking. Following next on the value driver list is the operating margin, as the competition in the smart phone business heats up.

            Step 3: The Data Assessment
            Once you have the value drivers identified, the next step is collecting data on these variables, as a precursor for developing probability distributions. In developing the distributions, you can draw on the following:

            1. Past data: If the value driver is a macroeconomic variable, say interest rates or oil prices, you can draw on historical data going back in time. My favored site for all things macroeconomic is FRED, the Federal Reserve data site in St. Louis, a site that combines great data with an easy interface and is free. I have included data on interest rate, inflation, GDP growth and the weighted dollar for those of you interested in US data in the attached link. For data on other countries, currencies and markets, you can try the World Bank data base, not as friendly as FRED, but rich in its own way.
            2. Company history: For companies that have been in existence for a long time, you can mine the historical data to get a measure of how key company-specific variables (revenues, operating margin, tax rate) vary over time. 
            3. Sector data: You can also look at cross sectional differences in key variables across companies in a sector. Thus, to estimate the operating margin for Amazon, you could look at the distribution of margins across retail companies.: If the value driver is a macroeconomic variable, say interest rates or oil prices, you can draw on historical data going back in time. My favored site for all things macroeconomic is FRED, the Federal Reserve data site in St. Louis, a site that combines great data with an easy interface and is free. I have included data on interest rate, inflation, GDP growth and the weighted dollar for those of you interested in US data in the attached link. For data on other countries, currencies and markets, you can try the World Bank data base, not as friendly as FRED, but rich in its own way.
            In the case of Apple, I isolated my data assessment to three variables: revenue growth, operating margin and the cost of capital.  To get some perspective on the range and variability in revenue growth rates and operating margins, I started by looking at the values for these numbers annually from 1990 to 2015:


            This extended time period does distract from the profound changes wrought at Apple over the last decade by the iPhone. To takes a closer look at its effects, I looked at growth and margins at Apple for every quarter from 2005 to the first quarter of 2016 :
            Superimposed on this graph of gyrating revenue growth, I have traced the introduction of the different iPhone models that have been largely responsible for Apple's explosive growth over the last decade. There are a few interesting patterns in this graph. The first is that revenue growth is clearly driven by the iPhone cycle, peaking soon after each new model is introduced and fading in the quarters after. The second is that the effect of a new iPhone on revenue growth has declined with each new model, not surprising given the scaling up of revenues as a result of prior models. The third is that the operating margins have been steady through the iPhone cycles, with only a midl dip in the last cycle. There is good news and bad news in this graph for Apple optimists. The good news is that the iPhone 7 will deliver an accelerator to the growth but the bad news is that it will be milder that the prior versions; if the trend lines hold up, you are likely to see only a 10-15% revenue growth in the quarters right after its introduction. 

            To get some perspective on what the revenue growth would look like for Apple, if it's iPhone franchise fades, I looked at the compounded annual revenue growth for US technology firms older than 25 years that were still listed and publicly traded in 2016:

            Of the 343 firms in the sample, 26.2% saw their revenues decline over the last 10 years. There is a sampling bias inherent in this analysis, since the technology firms with the worst revenue growth declines over the period may not have survived until 2016. At the same time, there were a healthy subset of aging technology firms that were able to generate revenue growth in the double digits over a ten-year period. 

            Step 4: Distributional Assumptions
            There is no magic formula for converting the data that you have collected into probability distributions, and as with much else in valuation, you have to make your best judgments on three dimensions.
            1. Distribution Type: In the section above, I broadly categorized the uncertainties you face into discrete vs continuous, symmetric vs skewed and fat tail vs thin tail. At the risk of being tarred and feathered for bending statistical rules, I have summarized the distribution choices based on upon these categorizations. The picture is not comprehensive but it can provide a road map though the choices:
            2. Distribution Parameters: Once you have picked a distribution, you will have to input the parameters of the distribution. Thus, if you had the good luck to have a variable be normally distributed, you will only be asked for an expected value and a standard deviation. As you go to more complicated distributions, one way to assess your parameter choices to look at the full distribution, based upon your parameter choices, and pass it through the common sense test.
            In the case of Apple, I will use the historical data from the company, the cross sectional distribution of revenue growth across older technology companies as well as a healthy dose of subjective reasoning to pick a lognormal distribution, with parameters picked to yield values ranging from -4% on the downside to +10% on the upside. On the target operating margin, I will build my distribution around the 25% that I assumed in my base case and assume more symmetry in the outcomes; I will use a triangular distribution to prevent even the outside chance of infinite margins in either direction.
            Note the correlation between the two, which I will talk about in the next section.

            Step 5: Build in constraints and correlations
            There are two additional benefits that come with simulations. The first is that you can build in constraints that will affect the company's operations, and its value, that are either internally or externally imposed. For an example of an external constraint, consider a company with a large debt load. That does not apply to Apple but it would to Valeant. If the company's value drops below the debt due, you could set the equity value to zero, on the assumption that the company will be in default. As another example, assume that you are valuing a bank and that you model regulatory capital requirements as part of your valuation. If the regulatory capital drops below the minimum required, you can require the company to issue more shares (thus reducing the value of your equity).  The second advantage of a simulation is that you can build in correlations across variables, making it more real life. Thus, if  you believe that bad outcomes on margins (lower margins than expected) are more likely to go with bad outcomes on revenue growth (revenue growth lower than anticipated), you can build in a positive correlation between the variables. With Apple, I see few binding constraints that will affect the valuation. The company has little chance of default and is not covered by regulatory constraints on capital. I do see revenues and operating margins moving together and I build in this expectation by assuming a correlation of 0.50 (lower than the historical correlation of 0.61 between revenues and operating margin from 1989 to 2015 at Apple).

            Step 6: Run the simulations
            Using my base case valuation of Apple (which yielded the value per share of $126.47) as my starting point and inputting the distributional assumptions for revenue growth and operating margin, as well as the correlation between the two, I used Crystal Ball to run the simulations (leaving the number at the default of 100,000) and generated the following distribution for value:

            The percentiles of value and other key statistics are listed on the side. Could Apple be worth less than $93/share. Yes, but the probability is less than 10%, at least based on my assumptions. Having bought and sold Apple three times in the last six years (selling my shares last summer), this is undoubtedly getting old, but I am an Apple shareholder again. I am not a diehard believer in the margin of safety, but if I were, I could use this value distribution to create a more flexible version of it, increasing it for companies with volatile value distributions and reducing it for firms with more stable ones.

            The most serious concern that I have, as an investor, is that I am valuing cash , which at $232 billion is almost a third of my estimated value for Apple, as a neutral asset (with an expected tax liability of $28 billion). Some of you, who have visions of Apple disrupting new businesses with the iCar or the iPlane may feel that this is too pessimistic and that there should be a premium attached for these future disruptions. My concern is the opposite, i.e., that Apple will try to do too much with its cash, not too little. In my post on aging technology companies, I argued that, like aging movie stars in search of youth, some older tech companies throw money at bad growth possibilities. With the amount of money that Apple has to throw around, that could be deadly to its stockholders and I have to hope and pray that the company remains restrained, as it has been for much of the last decade.

            Conclusion
            Uncertainty is a fact of life in valuation and nothing is gained by denying its existence. Simulations offer you an opportunity to look uncertainty in the face, make your best judgments and examine the outcomes. Ironically, being more open about how wrong you can be in your value judgments  will make you feel more comfortable about dealing with uncertainty, not less. If staring into the abyss is what scares you, take a peek and you may be surprised at how much less scared you feel.

            YouTube video


            Attachments
            1. Paper on probability distributions
            2. Apple valuation - May 2016
            3. Link to Oracle Crystal Ball trial offer
            1. If you have a D(discount rate) and a CF (cash flow), you have a DCF.  
            2. A DCF is an exercise in modeling & number crunching. 
            3. You cannot do a DCF when there is too much uncertainty.
            4. The most critical input in a DCF is the discount rate and if you don’t believe in modern portfolio theory (or beta), you cannot use a DCF.
            5. If most of your value in a DCF comes from the terminal value, there is something wrong with your DCF.
            6. A DCF requires too many assumptions and can be manipulated to yield any value you want.
            7. A DCF cannot value brand name or other intangibles. 
            8. A DCF yields a conservative estimate of value. 
            9. If your DCF value changes significantly over time, there is something wrong with your valuation.
            10. A DCF is an academic exercise.

            Icahn exits, Buffett enters, Whither Apple? Value and Price Effects of Big Name Investing

            $
            0
            0

            In my last post, I looked at Apple, arguing, with a Monte Carlo simulation, that the stock was a good investment at the prevailing market price ($93 at the time of the analysis). I appreciate the many comments that I got on the analysis, some taking issue with the distributions that I used for profit margins and revenue growth and some taking me to task for ignoring the fact that big name investors were either entering and exiting the stock. Those who felt that my valuation was optimistic pointed out that Carl Icahn, a long time and very vocal investor in Apple, had decided to sell his stake in the company on April 28. Some who concurred with my value judgment on Apple pointed out that Berkshire Hathaway (and by extension, Warren Buffett or his proxies) had invested in the company on May 16.  Should Carl Icahn’s decision to sell Apple or Berkshire Hathaway’s choice to buy it change my assessments of value or views on its price? More generally, should the decisions by "big name" investors to buy or sell a specific company affect your investment judgments about that company? 

            Price versus Value: The Set Up
            To set up the discussion of whether, and if so how, the actions of other investors, especially those with big names and reputations to match, affect your investing choices, I will fall back on a device that I have used before, where I contrast the value and pricing processes.


            Put simply, the value process is driven by a company's fundamentals (cash flows, growth and risk) or at least your perception of those fundamentals, whereas  the pricing process is driven by demand and supply, with mood, momentum and liquidity all playing big roles in determining price. In an earlier post,  I argued that it these processes that separate investors from traders, with investors focused on the drivers of value and traders on the pricing process, and that the skills and tools that you need to be a successful trader are different from those that you need to be a successful investor. To understand how and why the entry of a big name investor may alter your assessments of value and price, I would suggest categorizing that investor into one of four types.
            1. An Insider, who is either part of management or has privileged access to management.
            2. An Activist, who plans to change the way the firm is run or financed.
            3. A Trader, whose skill lies in playing the pricing game, with the power to either reinforce or reverse price momentum
            4. A Value Investor, who has valued the company and is willing to take a position based upon that value, on the expectation that the pricing gap will close.
            Each type of big name investor has the potential to change how you view the dynamics of price and value, though the place where the change occurs will depend on the investor type.

            The entry (or exit) of a big name insider or big name activist can alter your estimate of value for a company, by either changing your perceptions of cash flows, growth and risk or by having the potential to change the company's operating and financing characteristics. As a trader, the entry or exit of a big name trader may cause you to move from one side of the pricing game to the other, i.e., shift you from being a buyer to a seller. Finally, as a long term value investor who believes that a stock is mis-priced but has little or no power to cause the pricing gap to close, the entry of a big name value investor can provide a catalyst for the correction.

            The Value Effect 
            If you asked a value purist whether the actions of other investors affect his or her value, the answer will almost always be "of course not". After all, the essence of intrinsic value is that it is determined not by what others think about the company but the company's capacity to generate cash flows  over time. That said, there are two ways that the investment action (to buy or sell) of a big name investor can change your assessment of value. 

            1. The first is if the big name investor has private information or is perceived as knowing more about the firm than you do. While that may walk awfully close to the insider trading line in the United States, it is entirely possible that the investor's information is diffuse enough to not be in violation of the law. In this case, it is entirely rational for you, as an investor, to reassess your cash flows and risk, based upon the insiders' actions. That is perhaps why we are so fascinated by insider trading, where the perception is that insider buying is value increasing and insider selling is value selling. In some emerging markets, where possessing proprietary information is neither illegal nor unusual, and the decision by an investor who is perceived as having this information (an insider, manager or family member) to buy (or sell) is an indicator that your value should be increased (decreased). 
            2. The other scenario is where the big name investor is an activist who plans to push for changes in the way the company operates, how it is financed or how much and how it returns cash to investors. The potential effects of these changes can be most easily seen using a financial balance sheet:

            To the extent that you believe that the company will have to respond to activist pressure, your assessment of value will change. An asset restructuring can alter he cash flows and risk characteristics of a business, changing your estimate of value, though the direction of the value change and its magnitude will depend on how you see these operating changes playing out in cash flows and growth.  Adding debt to your financing mix can add value to a firm (because of the tilt in the tax code towards debt) or destroy value (because it exposes companies to bankruptcy risk). If you are valuing a company, the entry of a big name activist investor in the ranks with a history of pushing for more debt could lead you to reassess your value estimate as well. Returning more cash to stockholders in special dividends or buybacks can change value either upwards (if the market is discounting the cash on the presumption that the company would waste the cash on bad investments/acquisitions) or downwards (if returning the cash will expose the firm to default risk or substantial financing costs in the future).

            The Pricing Effect
            In some cases, the big name investing in the stock is a trader, doing so on the expectation that momentum will either continue, sustaining the pricing trend, or that momentum will reverse, causing the trend to reverse as well. Since this trade is not motivated by either new information or the desire to change how the company is run, there is no value effect, but there can be a price effect for two reasons. 
            1. The volume effect: If the big name trader has enough money to back his or her trade, there will be a liquidity effect, where a buy will push the price up higher and a sell will push it lower. 
            2. The bandwagon effect: To the extent that there are some in the market who perceive the big name trader as better at perceiving momentum swings than the rest of us, they will follow the investor in buying or selling the stock. 
            In contrast to a value effect, which is long term and sustained, the pricing effect will have a shorter half life. To the extent that the big name trader's time horizon may be even shorter, he or she can still make money from the bandwagon effect. To get a measure of the pricing effect of a big name trade, you have to look at both the resources commanded by the trader as well as the liquidity/trading volume in the stock. A trader with billions under his control investing in a lightly traded and lightly followed stock will have a much bigger pricing effect than in a very liquid, large market capitalization company. 

            The Catalyst Effect
            It is an undeniable and frustrating truth about value investing that for most of us, it is not just enough to be right in your assessment of value but you have to get the market to correct its mistakes to make money on your investments. If you are a small investor, there is little that you can do to close the pricing gap because you have neither the money or the megaphone to close the gap. A big name value investor, though, may be more successful for two reasons: he or she can take a larger position in the stock and as with the big name trader, create a bandwagon effect where other value investors will follow into the stock.  Again, the magnitude of the catalyst effect will vary across both investors and companies. The extent of the impact on the pricing gap will depend in large part on the history of success that the big name investor brings into the investment, with sustained success in the past going with a larger impact. 

            Apple, Icahn and Buffett
            It has taken me a while to get to the point of this post, which was ostensibly about Apple and how Icahn’s exit and Buffett’s entry into the stock affect my thinking. At first sight, this graph shows how the market reacted to their actions:

            While it does look like Icahn's sale had a negative effect (albeit mild) and Berkshire's buy had a positive effect (almost as mild), I plan to use the framework of the last section to assess each of these investors and gauge how it should affect my thinking about the stock.

            Icahn, the Activist Trader
            Through much of his tenure, Carl Icahn has been labeled an activist investor but I will take issue with at least a portion of that label. It is true that Icahn is an activist, though he is much more active on the financing/dividend dimension (pushing companies to borrow money and return cash) than on the operating dimension. I do think that Icahn is more of a trader than an activist, more focused on momentum and pricing than on value and this is illustrated by the tools that brings to the assessment. When Icahn was asked why he invested in Lyft in 2015, his response was that it looked cheap relative to Uber, a classic pricing argument. With Apple, in his bullish days, Icahn argued that it was cheap, but consider how he justified his contention in May 2015, that Apple, then trading at $100, should really be trading at $240. In effect, he forecast out earnings per share in 2016 to be $12, applied a PE ratio of 18 and added the cash balance of $24.44/share. Not only is this definitely not an intrinsic valuation, it is at best "casual pricing", i.e., the type of pricing you would do on the back of an envelope after you have had a little too much to drink.

            Before you point out to me that Icahn is worth billions and I am not, let me hasten to add that there is nothing ignoble about trading and that Icahn has been an incredibly successful trader over the last few decades, testimonial to his targeting and trading skills. It does color how I viewed Icahn’s investment in Apple in January 2014, his push at Apple for more dividends and more debt during his days as a Apple investor and his decision to sell his holdings on April 2016. I was already an investor in Apple in January 2014, when Icahn bought his shares, and while I did not view his decision to buy the shares as vindication of my valuation, I welcomed him to the shareholder ranks both because Apple was badly in need of a momentum shift and Icahn was playing both an activist and a catalyst role. I am glad that he put pressure on Apple to get over its unwillingness to borrow money and to return more cash in dividends and buybacks. His decision to depart does tells me two things. First, Icahn has recognized the limitations of financing and dividend policy changes in driving Apple’s value and is moving on to companies where the payoff is greater from financial reengineering. Second, it is possible that Icahn’s momentum detector is telling him that while Apple’s stock price may not be going lower, it has little room to go higher either, at least in the short term, and given his trading track record, I would take that signal seriously,

            Buffett Buys In?
            The decision by Berkshire Hathaway to invest in Apple about three weeks after Icahn’s departure mollified some worried Apple investors, since there is more desirable endorsement in all of value investment than Warren Buffett’s buy order. I am not privy to the inner workings in Omaha, but I have a feeling that this decision was made more by Todd Combs and Ted Wechsler, the co-heads that Buffett hired as his successors, than by Buffett, but let’s assume that Buffett was the initiator of this investment. What does that tell you about Apple stock? The good news is that the greatest value investor of this generation now considers Apple to be a value stock. The bad news is that this investor's biggest investment in a technology company has been in IBM, a company that delivers solid dividends and cash flows but has been liquidating itself gradually over the last ten years. If my value judgment on Apple had required substantial growth for value to be delivered, Buffett’s investment could very well have adversely affected my view on the company. In this case, though, I agree with his assessment that Apple is a mature company, with enough cash flows to cover dividends for a generation. 

            The Apple End Game
            In early May, when I analyzed Apple, I knew that Carl Icahn had already closed out his position and it had no impact on my value estimate or investment judgment. Icahn’s decision to sell was an indication to me that the price might not recover quickly and that momentum could work against me in the near term, but I was okay with that, since my time horizon was not constrained. Buffett’s decision (if it was his) to jump in, a couple of weeks later, may be an indication that the best days of Apple are behind it, but I had already made the same judgment in my valuation. If there is a silver lining, it is that Buffett's followers, with their large numbers and unquestioning, will imitate him and perhaps get the price gap to close. 

            The Dark Side of Big Name Investing
            While I am open to the possibility that the entry of a big name into a company has the potential to change the way I think about the company and perhaps my investment decisions, there are dangers embedded in doing so.
            1. Confirmation bias: It is a well-established fact that investors look for evidence that confirms decisions that they have already made and ignore evidence that contradicts it and big name investors feed into this bias. Thus, if you have bought a stock, you are far more likely to focus in on those big name investors who agree with you (and are either bullish on the stock or buy it) and screen out big name investors who do no.
            2. Mixed Motives: It is entirely possible that you (as an investor) may be misreading or misunderstanding the motives that caused the big name trade in the first place. In particular, the insider, who you assumed was trading because he or she had private information, may be selling the stock for tax or liquidity reasons. The activist, who you assumed was pushing for real changes in the company, may be more interested in collecting a payoff from the company to leave it alone. The trader, who you assumed had skills playing the momentum game, may himself be following the crowd rather than assessing momentum shifts. Finally, the value investor, who you assumed had valued the company and was pushing for the price/value gap to close, may be more trader than investor, quick to give up, if the stock moves in the wrong direction.
            There are some investors, including many institutional investors, whose entire investment strategy seems to be built around watching what big name investors do and imitating them. While imitation may be the best form of flattery, it is inauthentic and a poor basis for an investment philosophy, no matter who the big name investor that you are imitating is and how successful he or she has been. We are too quick to attribute investment success to skill and wisdom and that much of what passes for "smart" money is really "lucky" money. My advice is that if you have an investment thesis that leads you to buy the stock, do so and stop worrying about what the talking heads on CNBC or Bloomberg tell you about it. If you have so little faith in your reasoning that you doubt it and are ready to abandon it the moment it is contested by a big name, you should consider investing in index funds instead.

            YouTube Video

            The Brexit Effect: The Signals amidst the Noise

            $
            0
            0


            There are few events that catch markets by complete surprise but the decision by British voters to leave the EU comes close. As markets struggle to adjust to the aftermath, analysts and experts are looking backward, likening the event to past crises and modeling their responses accordingly. There are some who see the seeds of a market meltdown, and believe that it is time to cash out of the market. There are others who argue that not only will markets bounce back but that it is a buying opportunity. Not finding much clarity in these arguments and suspicious of bias on both sides, I decided to open up my crisis survival kit, last in use in August 2015, in the midst of another market meltdown.

            The Pricing Effect
            I am sure that you have been bombarded with news stories about how the market has reacted to the Brexit vote and I won't bore you with the gory details. Suffice to say that, for the most part, it has followed the crisis rule book: Government bond rates in developed market currencies (the US, Germany, Japan and even the UK) have dropped, gold prices have risen, the price of risk has increased and equity markets have declined. The picture below captures the fallout of the vote:

            While most of the reactions are not surprising, there are some interesting aspects worth emphasizing. 
            1. Currency Wars: If this is a battle, the British Pound is on the front lines and taking heavy fire, down close to 10% over the last week against the US dollar and approaching three-decade lows, with the Euro seeing collateral damage against the US dollar and the Japanese Yen.
            2. Old EU, New EU and the Rest of the World : The damage is greatest in the EU, but even within the EU, it is the old EU countries (primarily West European, that joined the EU prior to 2000) that have borne the biggest pain, with sovereign CDS spreads rising and stock prices falling the most. The new EU countries (mostly East European) have been hurt less than Britain's other trading partners (US, Australia and Canada) and the damage has been muted in emerging markets. At least for the moment, this is more a European crisis first than a global one.
            3. Banking Problems? Though I have seen news stories suggesting that financial service companies are being hurt more than the rest of the market by Brexit and that smaller companies are feeling the pain more than larger ones, the evidence is not there for either proposition at the global level. At more localized levels, it is entirely possible that it does exist, especially in the UK, where the big banks (RBS, Barclays) have dropped by 30% or more and mid-cap stocks have done far worse than their  large-cap counterparts.
            While I did stop the assessment as of Friday (6/24), the first two days of this trading week have continued to be volatile, with a big down day on Monday (6/27) followed by an up day on Tuesday (6/28), with more surprises to come over the next few days.

            The Value Effect
            As markets make their moves, the advice that is being offered is contradictory. At one end of the spectrum, some are suggesting that Brexit could trigger a financial crisis similar to 2008, pulling markets further down and the global economy into a recession, and that investors should therefore reduce or eliminate their equity exposures and batten down the hatches. At the other end are those who feel that this is much ado about nothing, that Brexit will not happen or that the UK will renegotiate new terms to live with the EU and that investors should view the market drops as buying opportunities. Given how badly expert advice served us during the run-up to Brexit, I am loath to trust either side and decided to go back to basics to understand how the value of stocks could be affected by the event and perhaps pass judgment on whether the pricing effect is under or overstated. The value of stocks collectively can be written as a function of three key inputs: the cash flows from existing investment, the expected growth in earnings and cash flows and the required return on stocks (composed of a risk free rate and a price for risk). The following figure looks at the possible ways in which Brexit can affect value:

            Embedded in this picture are the most extreme arguments.  Those who believe that Brexit is Lehman-like are arguing that it will lead to systemic shocks that will lower global growth (not just growth in the UK and the EU) and increase the price of risk. In this story, these shocks will come from banking problems spilling over into the rest of the economy or an unraveling of the EU.  Those who believe that Brexit’s effects are more benign are making a case that while it may reduce UK or even EU growth in the short term, the effects of global growth are likely to be small and/or not persistent and that the risk effect will dissipate once investors feel more reassured. 

            I see the truth as falling somewhere in the middle.  I think that doomsayers who see this as another Lehman have to provide more tangible evidence of systemic risks that come from Brexit. At least at the moment, while UK banks are being hard hit, there is little evidence of the capital crises and market breakdowns that characterized 2008. It is true that Brexit may open the door to the unraveling of the EU, a bad sign given the size of that market but buffered by the fact that growth has been non-existent in the EU for much of the last six years. If the European experiment hits a wall, it accelerate the shift towards Asia that is already occurring in the global economy. I also think that those who believe that is just another tempest in a teapot are too sanguine. The UK may be only the fifth largest economy in the world but it has a punch that exceeds its weight because London is one of the world's financial centers. I think that this crisis has potential to slow an already anemic global economy further. If that slowdown happens, the central banks of the world, which already have pushed interest rates to zero and below in many currencies will run out of ammunition. Consequently, I see an extended period of political and economic confusion that will affect global growth and some banks, primarily in the UK and the US, will find their capital stretched by the crisis and their stock prices will react accordingly. 

            The Bigger Lessons
            It is easy to get caught up in the crisis of the moment but there are general lessons that I draw from Brexit that I hope to use in molding my investment strategies.
            1. Markets are not just counting machines: One of the oft-touted statements about markets is that they are counting machines, prone to mistakes but not to bias. If nothing else, the way markets behaved in the lead-up to Brexit is evidence that markets collectively can suffer from many of the biases that individual investors are exposed to. For most of the last few months, the British Pound operated as a quasi bet on Brexit, rising as optimism that Remain would prevail rose and falling as the Leave campaign looked like it was succeeding. There was a more direct bet that you would make on Brexit in a gamblers' market, where odds were constantly updated and probabilities could be computed from these odds. Since Brexit was also one of the most highly polled referendums in history, you would expect the gambling to be closely tied to the polling numbers, right? The graph below illustrates the divide.
              While the odds in the Betfair did move with the polls, the odds of the Leave camp winning never exceeded 40% in the betting market, even as the Leave camp acquired a small lead in the weeks leading up to the vote. In fact, the betting odds were so sticky that they did not shift to the Leave side until almost a third of the votes had been counted. So, why were markets so consistently wrong on this vote? One reason, as this story notes,  is that the big bets in these markets were being made by London-based investors tilting the odds in favor of Remain. It is possible that these investors so wanted the Remain vote to win and so separated from this with a different point of view that they were guilty of confirmation bias (looking for pieces of data or opinion that backed their view). In short, Brexit reminds us that markets are weighted, biased counting machines, where if big investors with biases can cause prices to deviate from fair value for extended periods, a lesson perhaps that we learnt from value investors piling into Valeant Pharmaceuticals.
            2. No one listens to the experts (and deservedly so): I have never seen an event where the experts were all so collectively wrong in their predictions and so completely ignored by the public. Economists, policy experts and central banks all inveighed against exiting the EU, arguing that is would be catastrophic, and their warnings fell on deaf years as voters tuned them out. As someone who cringes when called a valuation expert, and finds some of them to be insufferably pompous,  I can see why experts have lost their cache. First, in almost every field including economics and finance, expertise has become narrower and more specialized than ever before, leading to prognosticators who are incapable of seeing the big picture. Second, while economic experts have always had a mixed track record on forecasting, their mistakes now are not only more visible but also more public than ever before. Third, the mistakes experts make have become bigger and more common as we have globalized, partly because the interconnections between economies means there are far more uncontrollable variables than in the past. Drawing a parallel to the investment world, even as experts get more forums to be public, their prognostications, predictions and recommendations are getting far less respect than they used to, and deservedly so.
            3. Narrative beats numbers: One of the themes for this blog for the last few years has been the importance of stories in a world where numbers have become more plentiful. In the Brexit debate, it seemed to me that the Leave side had the more compelling narrative (of a return to an an old Britain that some voters found appealing) and while the Remain side argued that this narrative was not plausible in today's world, its counter consisted mostly of numbers (the costs that Britain would face from Brexit). Looking ahead to similar referendums in other EU countries,  I am afraid that the same dynamic is going to play out, since few politicians in any EU country seem to want to make a full-throated defense of being Europeans first. 
            4. Democracy can disappoint (you): The parallels between political and corporate governance are plentiful and Brexit has brought to the surface the age-old debate about the merits of direct democracy. While some (mostly on the winning side) celebrate the power of free will, those who have never trusted people to make  reasoned judgments on their futures view the vote as vindication of their fears. In corporate governance, this tussle has been playing out for a while, with those who believe that shareholders, as the owners of public corporations, should control outcomes, at one end, and those who argue that incumbent managers and/or insiders are more knowledgeable about businesses and should therefore be allowed to operate unencumbered, at the other. I am sure that there are many in the corporate world who will look at the Brexit results and cheer for the Facebook/Google model of corporate governance, where shares with different voting rights give insiders control in perpetuity. As someone who has argued strongly for corporate democracy and against entrenching incumbent managers, it would be inconsistent of me to find fault with the British public for voting for Brexit.  In a democracy, you will get outcomes you do not like and throwing a tantrum (as some in the Remain camp are doing right now) or threatening to move (to Canada or Switzerland) are not grown-up responses.  You may not like the outcome, but as an American political consultant said after his candidate lost an election, "the people have spoken... the bastards".
            The End Game
            I have not bought or sold anything since the Brexit results for the simple reason that almost anything I do in the midst of a panic is more likely to be counter productive than helpful. To those who would argue that I should move my money away from Europe, the markets have already done that for me (by marking down my European stocks) and I see little to be gained by overdoing it. To those who assert that this is the time to buy, I am not a fan of blind contrarianism but I will be looking at UK-based companies that have significant non-European operating exposure in the hope that markets have knocked down their prices too much. Finally, to those who posit that this is aa financial meltdown, I will keep a wary eye on the numbers, looking for early signs that the worst case scenario is playing out. In my view, bank stocks will be the canaries in the coal mine, and especially so if the damage spreads to non-UK banks, and I will continue to estimate equity risk premiums for the S&P 500 and perhaps add the UK and Germany to the list to get a measure of how equity markets are repricing risk. 

            Tesla: It's a story stock, but what's the story?

            $
            0
            0

            The last few weeks have tested Tesla’s shareholders and frustrated short sellers in the stock. Shareholders have had to weather a series of bad news stories, ranging from a failure to meet its shipment targets in the last few months to a fatality with a driver using its autopilot function to a surprise acquisition of Solar City. While each of those stories has created pressure on the stock, the price has held up surprisingly well, frustrating long-time short sellers who have been waiting for a correction in what they see as an overhyped stock.
            Tesla Stock Price: Google Finance
            So, what gives here? Why has Tesla’s stock price not collapsed facing this adversity? I think that Tesla's price action illustrates the power of the “big story” and the sometimes difficult-to-understand market dynamics of story stocks.

            Story Stocks
            In earlier posts, I have made a case for valuation being a bridge between story and numbers, with every number telling a story and every story being captured in a number. Thus, while your final valuation may be composed of forecasts of revenue growth, profit margins and reinvestment, it is the story that binds together these numbers that represent the soul of the valuation.

            That said, the balance between stories and numbers can vary across companies and for the same company, can change across time. For most companies, it is the story that comes first, with numbers following, and for others, it is the numbers that tell the story. 

            There are some companies that I would classify as story stocks, where the story is so dominant in both how people price the stock and what determines its value that the numbers either fade into the background or have only a secondary effect. There are three characteristics that story stocks share:

            Amazon remains one of my longest-standing examples of a story stock, a company, with a CEO (Jeff Bezos) who was and continues to be clear about his ambitions to conquer big markets, told that story well and acted consistently with it. You can see why Tesla also has the makings of a story stock, going after a big market (automobiles and perhaps even clean energy), with an unconventional strategy for that market and a larger-than-life CEO in Elon Musk. With story stocks, it is the story that dominates how the market perceives the stock, and that has consequences:
            1. Story changes and information: it is shifts in the story that cause price and value changes. An earnings report that beats expectations (in either direction) or a news story of significance (good or bad) may not have any effect on either (value or price) if it does not change the story. Conversely, a shift in perceptions about the business story, triggered by minor news or even no news at all, can trigger major price changes. 
            2. Wider disagreements: When a company’s value is driven primarily by numbers, there is less room for disagreement among investors. Thus, when valuing a company in a market with steady revenue growth and sustainable profit margins, there will be less divergence in what investors think the stock is worth. In contrast, with a story stock, investor stories can span a much wider spectrum, leading to a much bigger range in values, as illustrated with Uber in this post
            The key to understanding story stocks is deciphering the story behind the company, then checking that story for reasonability and making it your own.

            The Tesla Story
            So, what is Tesla’s story? To structure the process, let me lay out the dimensions where investors can differ on the story and how these differences play out valuation. The first is Tesla's business, i.e., whether you see Tesla primarily as an automobile company that incorporates technology into its cars, a technology company that uses automobiles to deliver superior electronics (battery and software) or even a clean energy company with its focus on electric cars. The second is focus,  i.e., whether you believe that Tesla will cater more to the high end of whichever business you see it in or have mass market appeal. The third is the competitive edge that you see it bringing to the market, with the choices ranging from being first to the market, superior styling & brand name and superior (proprietary) technology. The fourth is the investment intensity needed to deliver your expected growth, with much higher reinvestment needed if you consider Tesla a conventional manufacturing company (like autos) than if you see it as a tech company. Finally, there is the risk in the company, with the auto story bringing with it the risks of cyclicality and high fixed costs and the tech story the risks of being rendered obsolete by new technologies and shorter life cycles.


            The value that you attach to Tesla will be very different if you consider it to be an automobile company, catering to a high-end clientele than if you view it as an electronics company with a superior technology (in electric batteries) and a mass market audience.

            My thinking on Tesla has changed over time. In my first valuation of the company in September 2013, I valued it as a high-end automobile company, which would use its competitive edges in branding and technology to generate high margins, with investment and risk characteristics more reflective of being an auto than a tech company. The resulting inputs into my valuation and valuation are summarized below:
            Download spreadsheet
            The value that I obtained for Tesla’s equity was $12.15 billion (with a value per share of $70) well below the market capitalization of $28 billion (and a sore price of $168.76) at the time.

            In July 2015 I took another look at Tesla, keeping in minding the developments since September 2013. The company had not only sent signals that it was moving towards offering vehicles with lower price tags (expanding towards the mass market) but also made waves with its plans for a $5 billion gigafactory to manufacture batteries. The focus on batteries suggested to me that I had understated the role that technology played in Tesla’s appeal and I incorporated it more strongly into my story. Tesla remained an automobile company, but with a much stronger technology component and wider market aspirations, which in turn led the following inputs into value:
            Download spreadsheet
            The value of equity based on these inputs was 19.5 billion (share price of $123), much higher than my September 2013 estimate, but still below the value of $33 billion (share price of $220) at the time.

            I took my third shot at valuing Tesla about two weeks ago,  just prior to its Solar City acquisition announcement, and I incorporated the news since my last valuation. The announcement of the Tesla 3 clearly reinforced my story line that it was moving towards being more of a mass market company. The unprecedented demand for the car, with close to 400,000 people putting down deposits for a vehicle that will not be delivered until 2018, indicates the hold that it has on its customer base. I have tweaked the inputs to reflect these changes:
            Download spreadsheet
            The value of equity that I obtained was $25.8 billion (with a share price of $151/share), climbing from my July 2015 valuation but the market capitalization stayed at $33 billion. Before I embark on looking at how the Solar City acquisition and Musk's master plan have on the narrative, it is worth looking at how the value changes as a function of revenues, reinvestment and profit margin:
            Download spreadsheet
            Note that there are pathways that lead to the value at or above the current stock price but they all require navigating a narrow path of building up sales, earning healthy profit margins and reinvesting more like a technology company than an automobile company.

            So, what effect does acquiring Solar City have on the story? If nothing else, it muddies up the waters substantially, a dangerous development for a story stock and that is perhaps even why even long-term Tesla bulls and nonplussed. The most optimistic read is that  Tesla is now a clean energy company, with a potentially much larger market, but the catch is that Solar City's products don't have the cache that Tesla cars have as well as the competitive nature of the solar power market will push margins down. If you add the debt burden and reinvestment needs that Solar City brings into the equation, Tesla, already stretched in terms of cash flows, may be over extending itself. The most pessimistic read is that talk of synergy notwithstanding, this acquisition is more about Musk using Tesla stockholder money to preserve his legacy and perhaps get back at short sellers in Solar City.

            The X Factor: Elon Musk
            The Solar City acquisition spotlighted how difficult it is to separate Tesla, the company, from Elon Musk. Musk's strengths, and there are many, are at the core of Tesla's success but his weaknesses may hamstring the company.

            • On the plus side, Musk clearly fits the visionary mode, dreaming big, convincing customers, employees and investor to by into his dreams and, for the most part, working on making the dreams a reality. Like Bezos at Amazon and Steve Jobs at Apple, Musk had the audacity to challenge the status quo. 
            • On the minus side, Musk is less disciplined and focused than Bezos, whose story about Amazon has remained largely unchanged for almost 20 years, even as the company has expanded into new businesses and markets. In fact, as someone who has followed Apple for more than three decades, it seems to me that Musk shares more characteristics with Steve Jobs in his first iteration at Apple (which ended with him being fired) than he does with Steve Jobs in his second stint at the company. Musk is a large social media presence, but he does strike me a thin skinned, as his recent exchange with Fortune magazine about the autopilot fatality showed. 
            Your views on  what you think Tesla is worth will be a function of what you think about Elon Musk. If you believe, as some of his most fervent defenders do, that he is that rarest of combinations, a visionary genius who will deliver on this vision, you will find Tesla to be a good buy. At the other extreme, you consider him a modern version of P.T. Barnum, a showman who promises more than be can deliver, you will view Tesla as over valued. Wherever you fall in the Musk continuum, Tesla is approaching a key transition point in its life, a bar mitzvah moment so to speak, where the focus will shift from the story to execution, from master plans to supply chains, and we will find out whether Musk is as good at the latter as he is in the former.

            Can Musk the visionary become Musk the builder? He certainly has the capacity. After all, if you can get spaceships into outer space and back to earth safely, you should be able to build and deliver a few hundred thousand cars, right? Given Tesla's missteps on delivery and execution, though, Musk may not have the interest in the nitty gritty of operations, and if he does not, he may need someone who can take care of those details, replicating the role that Tim Cook played at Apple during Steve Job's last few years at the company.  

            Investment Direction
            Tesla is a company where there seems to be no middle ground. You are either for the company or against it, believe that it is on a pathway to being the next Apple or that it is worth nothing, a cheerleader or a doomsdayer. I think that both sides of this debate are over reaching. I don't buy the talk that Tesla is on its way to being the next trillion dollar company, especially since I have a tough time justifying its current valuation of $33 billion. Unlike some of the high-profile short sellers who seem to view Tesla as an over-hyped electric car company that is only a step away from tipping into default, I do believe that Tesla has a connection to its customers (and investors) that other auto companies would kill to possess, brings a technological edge to the game and has viable, albeit narrow, pathways to fair value.  I will choose to sit this investment out, letting others who are more nimble than I am or have more conviction than I do to take stronger positions in Tesla.

            1. Tesla (September 2013) valuation
            2. Tesla (July 2015) valuation
            3. Tesla (July 2016) valuation

            May you live in "exciting" times! An Updated Picture of Country Risk

            $
            0
            0

            About a year ago, I completed my first  update of a paper looking at all aspects of country risk, from political risk to default risk to equity risk, and wrote about my findings in three posts, one on how to incorporate risk in company value, the second on the pricing of country risk and the last one on decoding currencies. The twelve months since have been interesting, to say the least, and unsettling to many as markets were buffeted by crises. In August 2015, a month after my posts, we had questions about China, its economy and markets play out on the global arena, leading to this post with my China story. Towards the end of June 2016, we had UK voters choosing to exit the EU, and that too caused waves (or at least ripples) through markets, which I talked about in this post. It is a good time to update my global country risk database and the paper that goes with it, and in this post, I would like to focus on updating numbers and providing risk pictures of the world, as it looks today.

            Country Risk: Non-market measures
            This should go without saying, but since there is still resistance in some practitioner circles to this notion, I will say it anyway. Some countries are riskier to invest in, either as an investor or as a business, than others. The risk differences can be traced to a variety of factors including where the country is in the life cycle (growing, stable or declining?), the maturity of its political institutions (democracy or dictatorship?, smoothness of political transitions), the state of its legal system (in terms of both efficiency and fairness) and its exposure to violence. Not surprisingly, how you perceive risk differences will depend in large part on which dimension of risk you are looking at in a country.

            While I look at risk measures that look at threat of violence, degree of corruption, dependence of the economy on a commodity (or commodities) and protection of property rights individually in the full paper, I also report on a composite measure of risk that I obtain from Political Risk Services (PRS), a Europe-based service that measures country risk on a numerical scale, with lower (higher) numbers representing more (less) risk. The picture provides a heat map of the world using this measure as of July 2016.
            As we move from 2015 to 2016, it is interesting to see how much risk changed in countries, rather than the level of risk, and again using political risk score, the heat map above reports on changes in the PRS score over the last year (if you hover over a country, you should see it).

            Finally, there is an alternate and more widely used measure of country risk that focuses on country default risk, with sovereign ratings for countries from Moody's and Standard & Poors (among others) and the picture below provides these ratings, as of July 1, 2016, globally:


            via chartsbin.com

            I know that ratings agencies are much maligned after their failures during the 2008 crisis, but I do think that some of the abuse that they take is unwarranted. They often move in tandem and are generally slow to respond to big risk shifts, but I am glad that I have their snapshots of risk at my disposal, when I do valuation and corporate finance.

            Country Risk: Market Measures
            There are two problems with non-market measures like risk scores or sovereign ratings. The first is that they are neither intuitive nor standardized. Thus, a PRS score of 80 does not make a country twice as safe as one with a PRS score of 40. In fact, there are other services that measure country risk scores, where high numbers indicate high risk, reversing the PRS scoring. The second is that these non-market measures are static. Much as risk measurement services and ratings agencies try, they cannot keep up with the pace of real world developments. Thus, while markets reacted almost instantaneously to Brexit by knocking down the value of the British Pound and scaling down stock prices around the globe, changes in risk scores and ratings happened (if at all) more slowly.

            The first market measure of country risk that I would like to present is one that captures default risk changes in real time, the sovereign credit default swap (CDS) market. The heat map below captures sovereign CDS spreads globally, as of July 1, 2016:


            via chartsbin.com

            Note that the map, if you scroll across countries,  reports three numbers: the CDS spread as of July1, 2016, a CDS spread net of the US CDS (of 0.41%) as of July 1, 2016 and the in the sovereign CDS spread over the last twelve months. Reflecting the market's capacity to adjust quickly, the UK, for instance, saw a doubling in the market assessment of default risk over the last year. The limitation is that sovereign CDS spreads are available for only 64 countries, with more than half of the countries in the world, especially in Africa, uncovered.

            The second market measure of country risk is one that I have concocted that is based upon the default spread, but also incorporates the higher risk of equities, relative to government bonds, i.e., an equity risk premium (ERP) for each country. The process by which I estimate these equity risk premiums, which I build on top of a premium that I estimate every month for the S&P 500 (and by extension, use for all AAA ratted countries), is described more fully in this post from the start of the year. The updated ERPs for countries is captured in the heat map below.

            via chartsbin.com

            Note that as companies globalize, you need the entire map to estimate the equity risk premium  to value or analyze a multinational, since its risk does not come from where it is incorporated but where it does business.

            Conclusion
            I think that the way we think about and measure country risk is in its nascency and that we need richer and more dynamic measure the risk. I don't claim to have all of the answers, or even most of the answers, but I will continue to learn from market behavior and make my equity risk premiums more closely reflective of the risk in each country. I will probably regret this resolution next July, but I plan to make my country risk premium an annual update, just as I have my work on equity risk premiums.

            Papers
            1. Country Risk Premium: Determinants, Measures and Implications - The 2016 Update
            Data)
            1. Sovereign Ratings, by Country (July 2016)
            2. Sovereign CDS Spreads, by Country (July 2016)
            3. Equity Risk Premiums, by Country (July 2016)
            Last year's Posts on Country Risk

              May you live in "exciting" times! An Updated Picture of Country Risk

              $
              0
              0

              About a year ago, I completed my first  update of a paper looking at all aspects of country risk, from political risk to default risk to equity risk, and wrote about my findings in three posts, one on how to incorporate risk in company value, the second on the pricing of country risk and the last one on decoding currencies. The twelve months since have been interesting, to say the least, and unsettling to many as markets were buffeted by crises. In August 2015, a month after my posts, we had questions about China, its economy and markets play out on the global arena, leading to this post with my China story. Towards the end of June 2016, we had UK voters choosing to exit the EU, and that too caused waves (or at least ripples) through markets, which I talked about in this post. It is a good time to update my global country risk database and the paper that goes with it, and in this post, I would like to focus on updating numbers and providing risk pictures of the world, as it looks today.

              Country Risk: Non-market measures
              This should go without saying, but since there is still resistance in some practitioner circles to this notion, I will say it anyway. Some countries are riskier to invest in, either as an investor or as a business, than others. The risk differences can be traced to a variety of factors including where the country is in the life cycle (growing, stable or declining?), the maturity of its political institutions (democracy or dictatorship?, smoothness of political transitions), the state of its legal system (in terms of both efficiency and fairness) and its exposure to violence. Not surprisingly, how you perceive risk differences will depend in large part on which dimension of risk you are looking at in a country.

              While I look at risk measures that look at threat of violence, degree of corruption, dependence of the economy on a commodity (or commodities) and protection of property rights individually in the full paper, I also report on a composite measure of risk that I obtain from Political Risk Services (PRS), a Europe-based service that measures country risk on a numerical scale, with lower (higher) numbers representing more (less) risk. The picture provides a heat map of the world using this measure as of July 2016.
              As we move from 2015 to 2016, it is interesting to see how much risk changed in countries, rather than the level of risk, and again using political risk score, the heat map above reports on changes in the PRS score over the last year (if you hover over a country, you should see it).

              Finally, there is an alternate and more widely used measure of country risk that focuses on country default risk, with sovereign ratings for countries from Moody's and Standard & Poors (among others) and the picture below provides these ratings, as of July 1, 2016, globally:


              via chartsbin.com

              I know that ratings agencies are much maligned after their failures during the 2008 crisis, but I do think that some of the abuse that they take is unwarranted. They often move in tandem and are generally slow to respond to big risk shifts, but I am glad that I have their snapshots of risk at my disposal, when I do valuation and corporate finance.

              Country Risk: Market Measures
              There are two problems with non-market measures like risk scores or sovereign ratings. The first is that they are neither intuitive nor standardized. Thus, a PRS score of 80 does not make a country twice as safe as one with a PRS score of 40. In fact, there are other services that measure country risk scores, where high numbers indicate high risk, reversing the PRS scoring. The second is that these non-market measures are static. Much as risk measurement services and ratings agencies try, they cannot keep up with the pace of real world developments. Thus, while markets reacted almost instantaneously to Brexit by knocking down the value of the British Pound and scaling down stock prices around the globe, changes in risk scores and ratings happened (if at all) more slowly.

              The first market measure of country risk that I would like to present is one that captures default risk changes in real time, the sovereign credit default swap (CDS) market. The heat map below captures sovereign CDS spreads globally, as of July 1, 2016:


              via chartsbin.com

              Note that the map, if you scroll across countries,  reports three numbers: the CDS spread as of July1, 2016, a CDS spread net of the US CDS (of 0.41%) as of July 1, 2016 and the in the sovereign CDS spread over the last twelve months. Reflecting the market's capacity to adjust quickly, the UK, for instance, saw a doubling in the market assessment of default risk over the last year. The limitation is that sovereign CDS spreads are available for only 64 countries, with more than half of the countries in the world, especially in Africa, uncovered.

              The second market measure of country risk is one that I have concocted that is based upon the default spread, but also incorporates the higher risk of equities, relative to government bonds, i.e., an equity risk premium (ERP) for each country. The process by which I estimate these equity risk premiums, which I build on top of a premium that I estimate every month for the S&P 500 (and by extension, use for all AAA ratted countries), is described more fully in this post from the start of the year. The updated ERPs for countries is captured in the heat map below.

              via chartsbin.com

              Note that as companies globalize, you need the entire map to estimate the equity risk premium  to value or analyze a multinational, since its risk does not come from where it is incorporated but where it does business.

              Conclusion
              I think that the way we think about and measure country risk is in its nascency and that we need richer and more dynamic measures of that risk. I don't claim to have all of the answers, or even most of the answers, but I will continue to learn from market behavior and make my equity risk premiums more closely reflective of the risk in each country. I will probably regret this resolution next July, but I plan to make my country risk premium an annual update, just as I have my work on equity risk premiums.

              Charts update: The charts don't seem to be working on some browsers. They seem to work on Safari.

              Papers
              1. Country Risk Premium: Determinants, Measures and Implications - The 2016 Update
              Data)
              1. Sovereign Ratings, by Country (July 2016)
              2. Sovereign CDS Spreads, by Country (July 2016)
              3. Equity Risk Premiums, by Country (July 2016)
              Last year's Posts on Country Risk

                Viewing all 146 articles
                Browse latest View live


                Latest Images